Graphs of Linear Functions
Key Questions
-
For a linear function of the form
#f(x)=ax+b# ,#a# is the slope, and#b# is the#y# -intercept.
I hope that this was helpful.
 Wataru
·
1
·
Nov 14 2014
Wataru
·
1
·
Nov 14 2014
-
Answer:
See below
Explanation:
#f(x) =x:forall x in RR# Let's think for a moment about what this means.
"#f# is function of#x# that is equal to the value#x# for all real numbers#x# "The only way this is possible is if
#f(x)# is a straight line through the origin with a slope of#1# .In slope/intercept form:
#y =1x +0# We can visualise
#f(x)# from the graph below.graph{x [-10, 10, -5, 5]}
Alan N. · 1 · Jun 18 2018
-
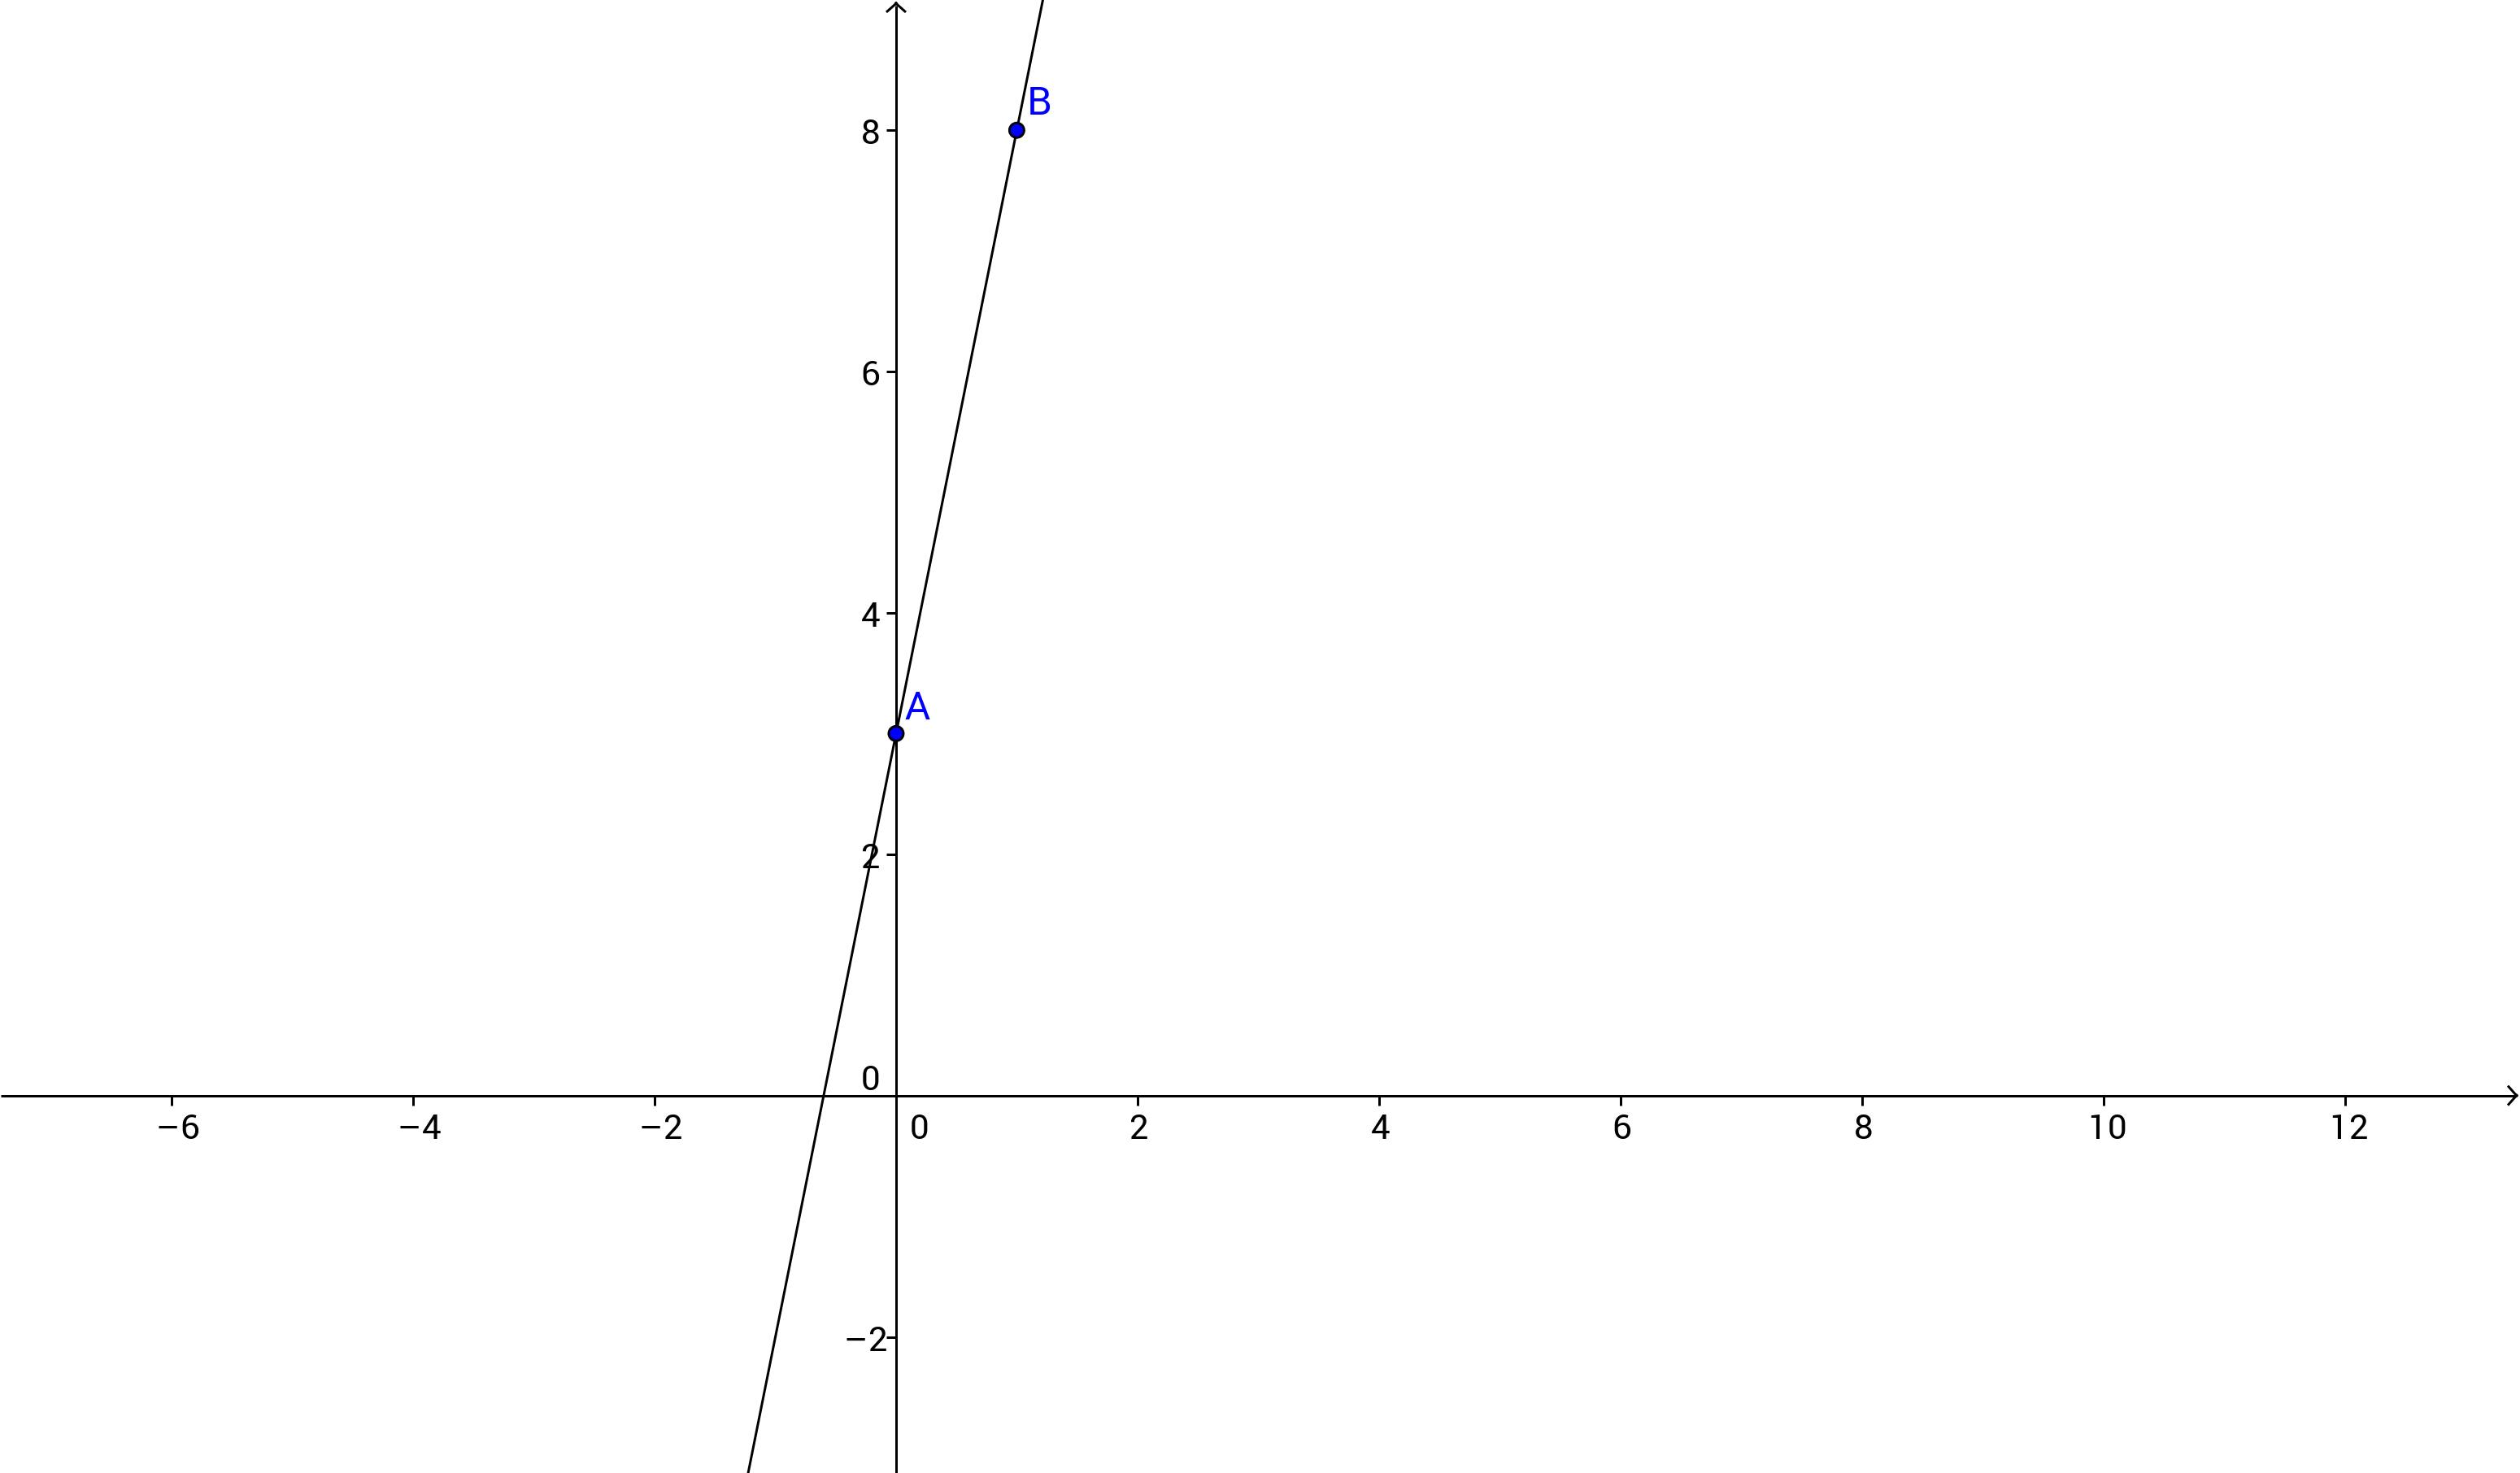
The easiest way (In my opinion) to graph a linear function is to enter two points, and connect them.
For example, the function:
#f(x) = 5x+3#
First you choose two#x# value. I will choose#0# and#1# . Then you enter them in the function one by one:
#f(0) = 5*0+3 = 3#
=> There is a point#(0,3)# , that's part of the function.#f(1) = 5*1+3 = 8#
=> There is a point#(1,8)# , that's part of the function.Since any line can be represented by two points, you can graph a linear function (line) by connecting the two points.
I hope this helped.
 Nico Ekkart
·
1
·
Dec 19 2014
Nico Ekkart
·
1
·
Dec 19 2014
Questions
Graphs of Linear Equations and Functions
-
Graphs in the Coordinate Plane
-
Graphs of Linear Equations
-
Horizontal and Vertical Line Graphs
-
Applications of Linear Graphs
-
Intercepts by Substitution
-
Intercepts and the Cover-Up Method
-
Slope
-
Rates of Change
-
Slope-Intercept Form
-
Graphs Using Slope-Intercept Form
-
Direct Variation
-
Applications Using Direct Variation
-
Function Notation and Linear Functions
-
Graphs of Linear Functions
-
Problem Solving with Linear Graphs