Determining Limits Graphically
Key Questions
-
I am not sure if there is a TI-84 Plus function that directly finds the value of a limit; however, there is a way to approximate it by using a table. Let us approximate the value of the limit
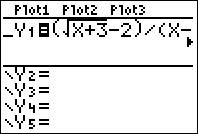
#lim_{x to 1}{sqrt{x+3}-2}/{x-1}# Step 1: Go to "Y=", then type in the function.
Step 2: Go to "TBL SET" (2nd+WINDOW), then set TblStart=.97 and
#Delta# Tbl=.01.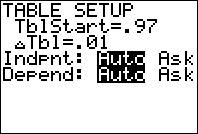
(Note: TblStart is the starting x-value in the table, so put a number slightly smaller that the number x approaches.
#Delta# Tbl is the increment value in the x-column, so make it sufficiently small for the precision you need.)Step 3: Go to "" TABLE (2nd+GRAPH).
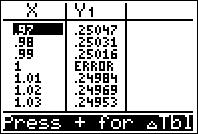
As you can see in the table above, the function value (
#Y_1# ) approaches 0.25 (or 1/4) as x approaches 1; therefore, we conclude that#lim_{x to 1}{sqrt{x+3}-2}/{x-1}=1/4#  Wataru
·
4
·
Sep 24 2014
Wataru
·
4
·
Sep 24 2014
-
If you're using a graph to find this limit, the first thing you'll want to do is graph the function.
#f(x)=x^2+2# is a parabola that looks like this: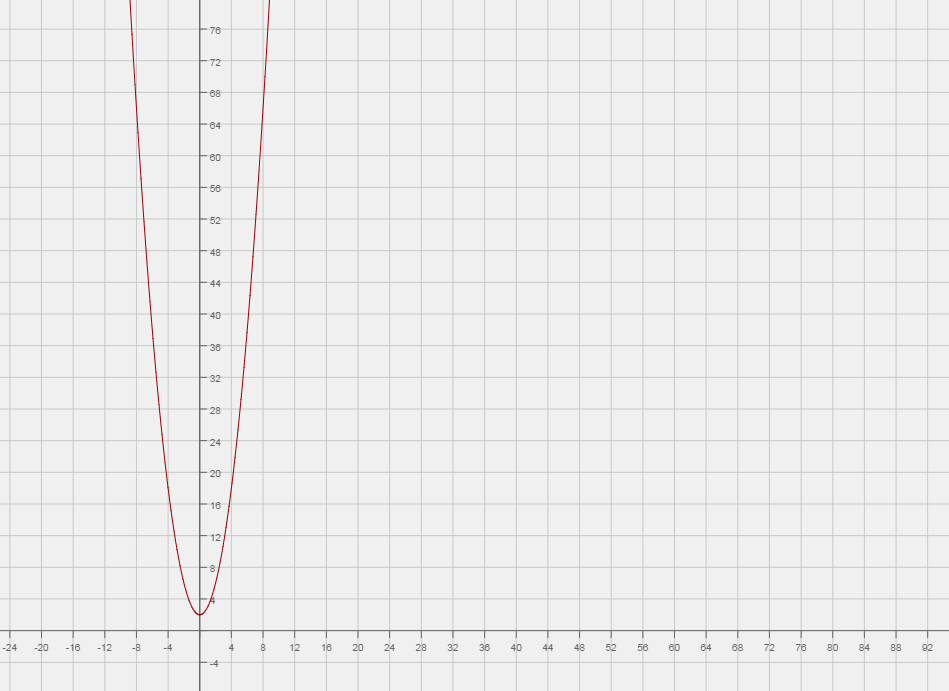
If you want to find out how to graph this, you can either draw the graph of a normal parabola and translate it vertically by two units upwards (2 is being added to the
#x^2# , which is why it goes up), or you can create a table of values and plug in input#x# values to get output#y# and you'll get an idea of the shape of the graph.Now we're interested in knowing what is happening at
#x# =5. Luckily, the function is defined there. If we look at the graph, at#x# =5, y=27. It's a little bit hard to tell on the graph because of the exponentially increasing y-values, but we know that#y# =27 because#y=(5^2+2)=27# . We can plug in#x# directly to find the limit because the function is defined and continuous there.To get an idea of an it intuitively means to find a limit on a graph though, you can look at the graph and decide what is happening at
#x# =5. When you move to#x# =5 from the right, what is#y# tending to? Well, to 27. Also, when you move to#x# =5 from the left, what is#y# tending it? 27 again. You can think of limits from the right and left as arrows pointing right and left respectively to the#x# value you're looking for. You're kind of trying to "pin point" what is exactly is happening at your graph at that given#x# point. In this case it's quite simply reading the#y# value off the graph, since the left and right limits tend to the same point and therefore are equal.So,
#lim_(x->5) (x^2+2)=27#  Sally
·
·
Sep 27 2014
Sally
·
·
Sep 27 2014
Questions
Limits
-
Introduction to Limits
-
Determining One Sided Limits
-
Determining When a Limit does not Exist
-
Determining Limits Algebraically
-
Infinite Limits and Vertical Asymptotes
-
Limits at Infinity and Horizontal Asymptotes
-
Definition of Continuity at a Point
-
Classifying Topics of Discontinuity (removable vs. non-removable)
-
Determining Limits Graphically
-
Formal Definition of a Limit at a Point
-
Continuous Functions
-
Intemediate Value Theorem
-
Limits for The Squeeze Theorem