Question #526b2
1 Answer

-There are more points above the best fit line than below it. Yes (barely) (4 vs. 3)
-The slope of the best fit line is positive. YES (barely) - 0.2554
Explanation:
-Data points are more clustered than spread out. NO
-The residual for point (39,940) is 12.75. NO
-The equation for the best fit line is y=−6.083x+930.016. NO
-There are more points above the best fit line than below it. Yes (barely)
-The correlation coefficient is 0.2. NO
-The equation for the best fit line is y=6.083x+930.016. NO
-The slope of the best fit line is positive. YES (barely)
First, construct the linear regression best-fit line. Calculate/record the slope and equation. Observe for distribution. Compute the correlation coefficient R.
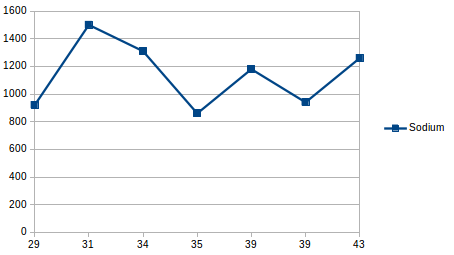
Line =
