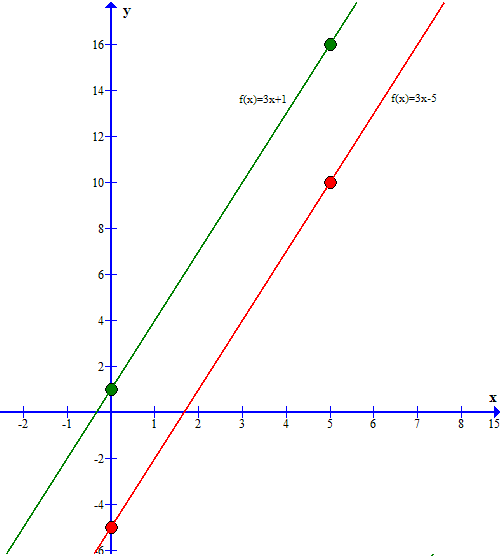
How do you graph each set of lines on the same graph: #y=3x-5, y=3x+ 1#?
1 Answer
Nov 14, 2016
Graph each line but use the same graph paper/surface.
Clearly label each line with it's equation. (Use of different colors might also be useful).
Explanation:
Sample points for
Sample points for