Observe that as #r^2=-9cos2theta#, we do not have a real value of #r# when #theta# is in the interval #(-pi/4,pi/4)# and #((3pi)/4,(5pi)/4)# as in these intervals #cos2theta# is positive and accordingly #r^2<0#.
Hence, in the domain of #theta# is #[pi/4,(3pi)/4]uu[(5pi)/4,(7pi)/4]#, let us consider known values of #theta# on unit circle
#{pi/4,pi/3,pi/2,(2pi)/3,(3pi)/4,(5pi)/4,(4pi)/3,(3pi)/2,(5pi)/3,(7pi)/4}#
and corresponding values of #r^2# are
#{0,9/2,9,9/2,0,0,9/2,9,9/2,0}#
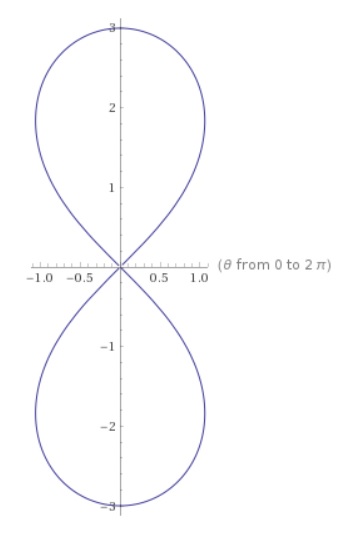
and values of #r# are #{0,3/sqrt2,3,3/sqrt2,0,0,3/sqrt2,3,3/sqrt2,0}#
and graph appears as