Can population growth be graphically represented?
1 Answer

Oct 20, 2017
Answer is YES
Explanation:
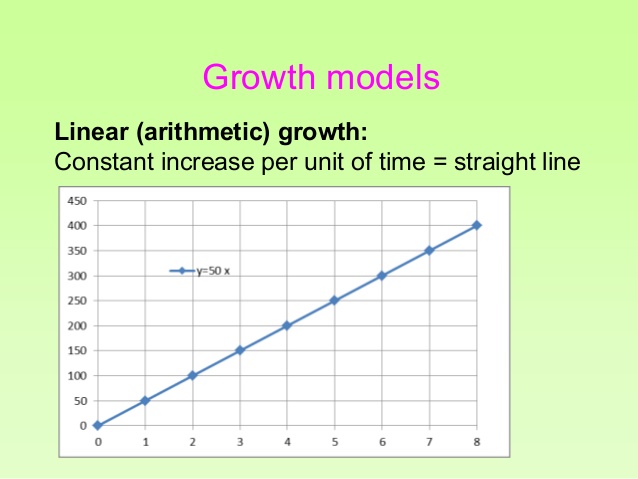
- Linear growth occurs when a population grows in same absolute number per year, may be increased by 750 individuals each year. It is possible to discover such trend, may be, when you measure workforce of a company every year.
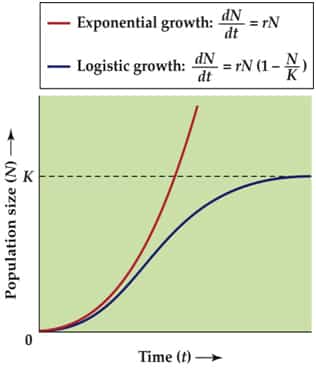
- Population may grow exponentially through geometric progression when supplied with all the resources to thrive. In this case, population grows in same percentage per year and the curve is J shaped.
- Though exponential growth could be seen in bacterial or yeast population kept in laboratories, population growth curve in nature actually shows logistic tendency. In such case, rate of population growth slows down as the population tends to reach carrying capacity of the environment, hence S shaped curve emerges.