Can someone help me with the rest ? and how to know if there is a relative max o or min ?
1 Answer

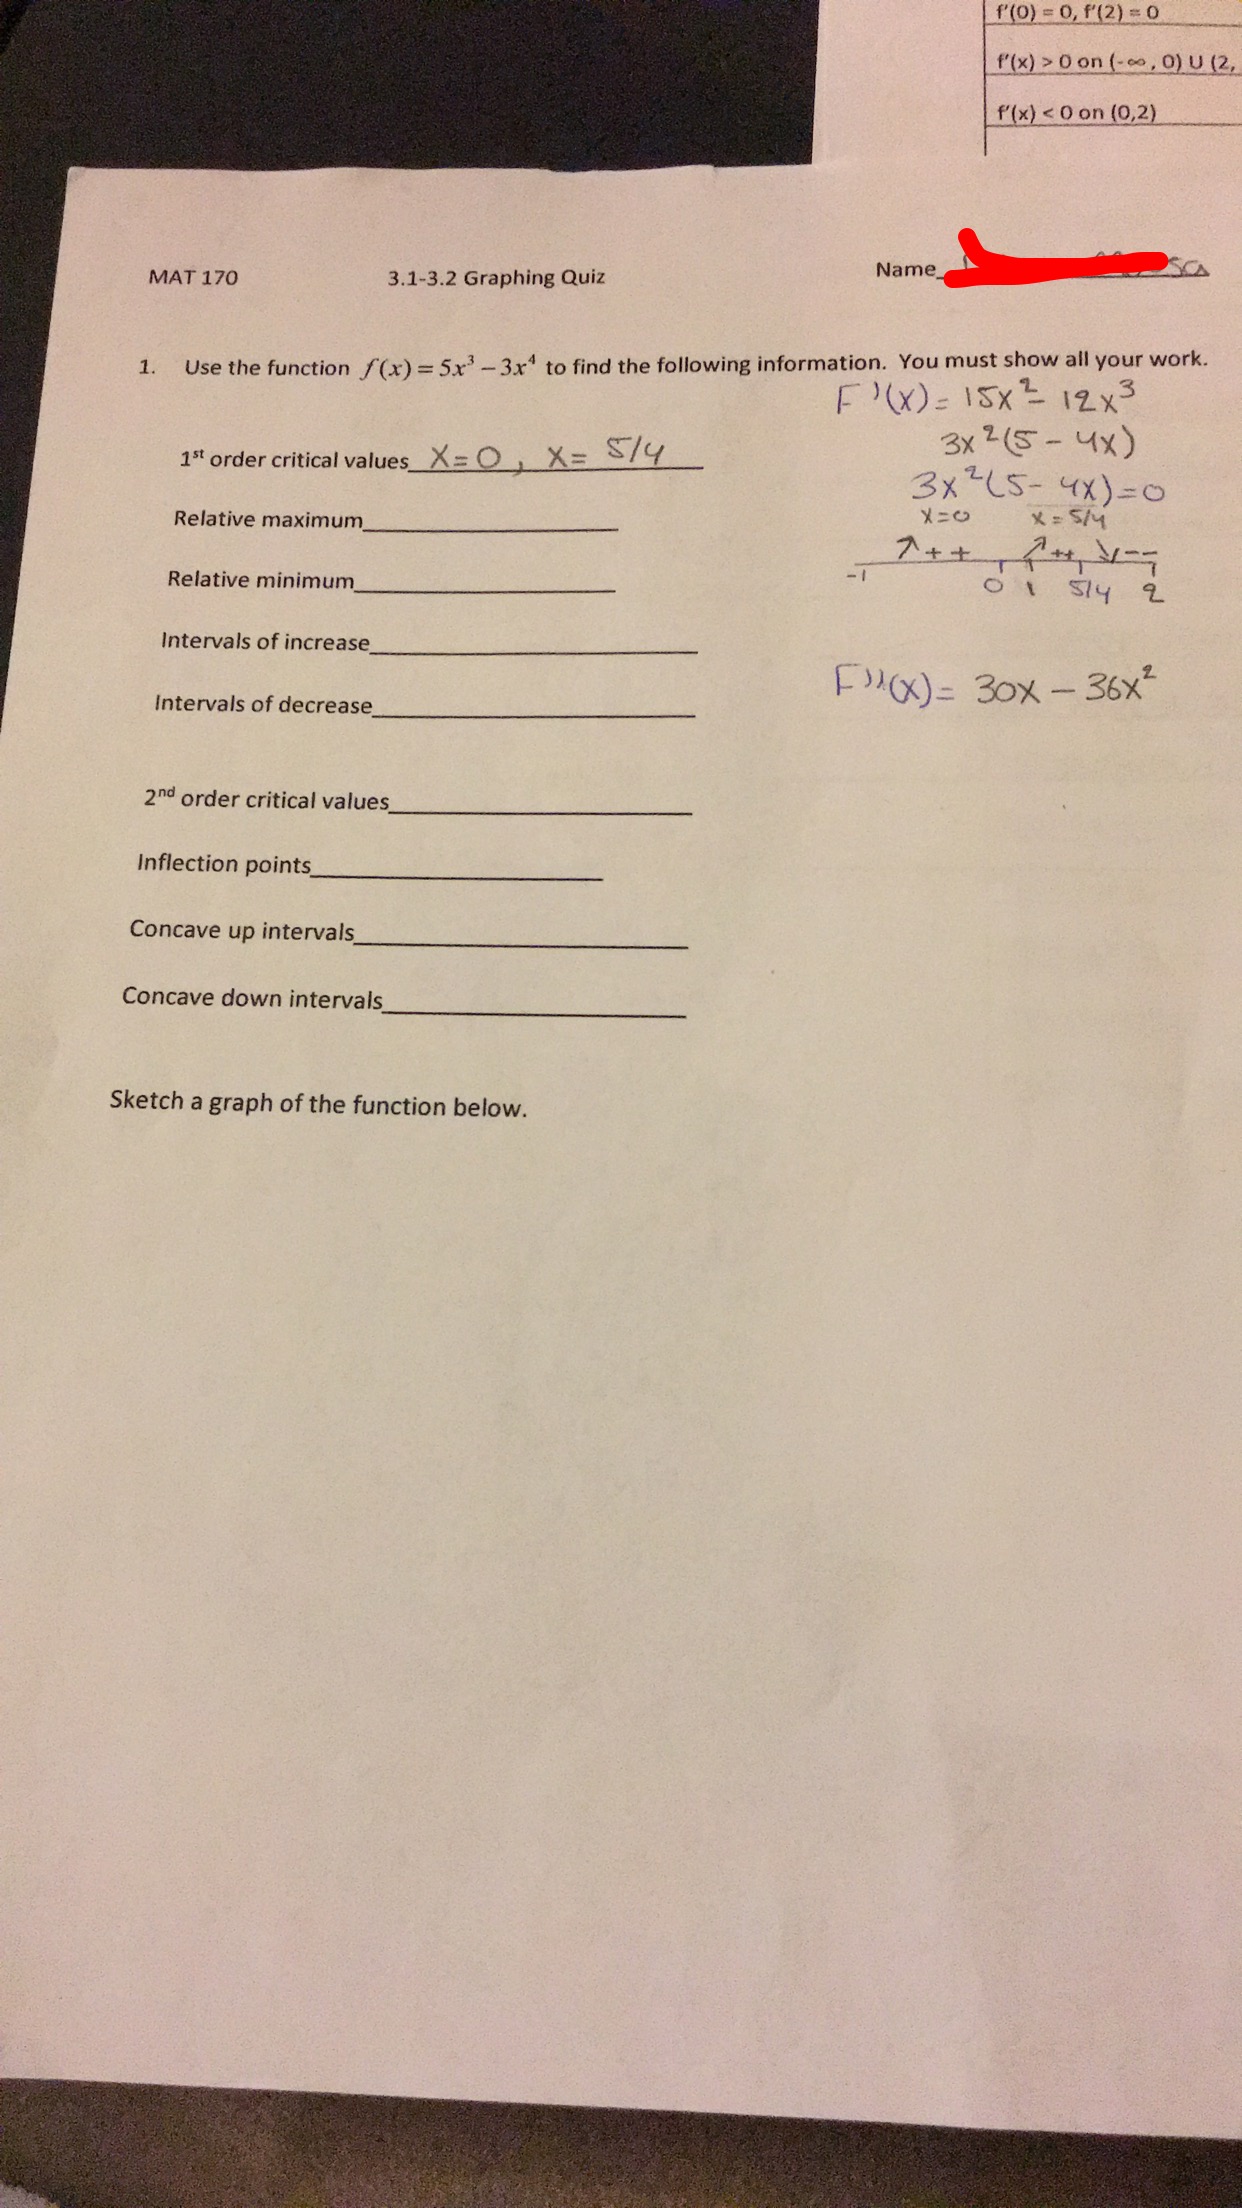
The rel max and min are found with the first derivative.
Explanation:
You're on the right track. You did the first interval test and found where the function is increasing and decreasing.
Based on your arrows the graph looks something like this:
/ / \ (it's better to visualize the graph if you draw the graph above the number line like a sin or cos graph)
For a max or min point, your graph is either forming a 'hill' shape or a 'hole' shape respectively. Looking at your 1st derivative test, you can see that a hill is formed only over the '5/4' point. This means that you have a max at 5/4.
For the levels of increase and decrease, these are where the graph is rising and falling. On this graph, you can see that it continues to rise from (neg. infinity to 5/4) and falls from (5/4 to pos. infinity).
For the second derivative, you do the same thing except for concavity: how it's opening. U or n.
