Domain and Range Graphs 2 ?

enter image source here

enter image source here

1 Answer
Feb 18, 2018

see below

Explanation:

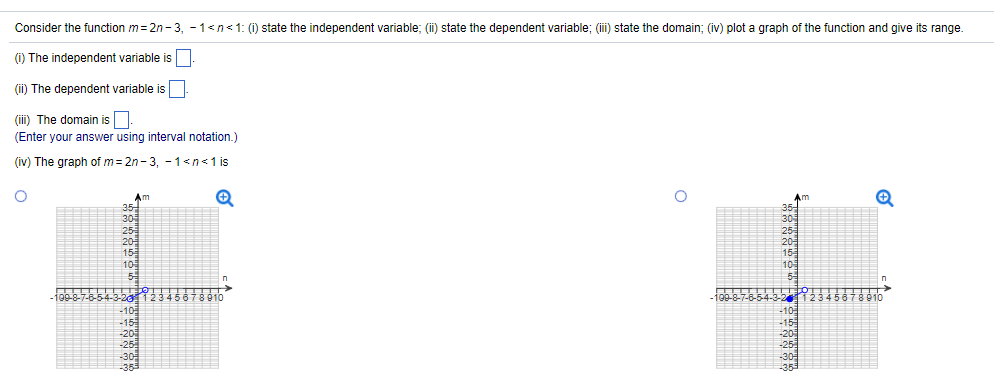
the independent variable is the variable used as an input.

the dependent variable is calculated by substituting a certain value in place of the independent variable, and applying the rules of a function to it.

here, the rules of the function #2n-3# (multiply by #2#, subtract #3# from the result) are being applied to #n#.

when #n# is substituted for a value in between #-1# and #1#, this value is multiplied by #2# and then #3# is subtracted from #2n#, giving #m#.

since #m# is the end result, it is the dependent variable.

the domain is the values that the independent variable can fall between.

here, the independent variable is #n#. #n# can fall between the values #-1# and #1# (but cannot be equal to either), so the domain is #-1 < n < 1#.

strong inequalities (#< >#) are used for the domain, meaning that #n# can equal neither #-1#, nor #1#.

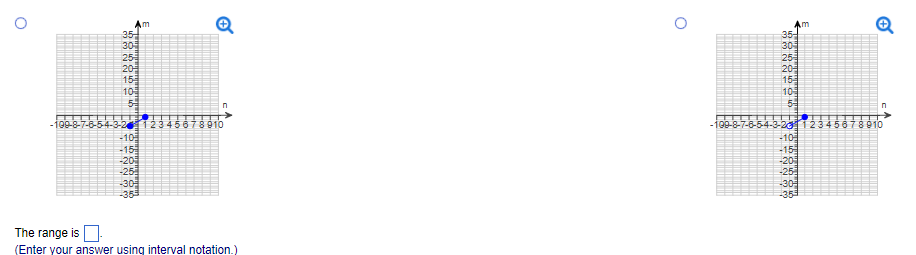
when drawing a graph, blank circles are used for strong inequalities #< >#. since the independent variable cannot be equal to the other value(s) in the inequality, the graph cannot touch the point made by the value and the other coordinate.

here, the strong inequality is next to the independent variable #n#. the points made if #n = -1# or #n = 1# (which are #(-1, -5)# and #(1, -1)#) do not exist on the line, so there are blank circles on these coordinates.

the graph on the top-left has two blank circles, for two strong inequalities, so it is the correct graph for the function.