Graph the function, in the answer box, describe the function please?

media.edgenuity.com

1 Answer
Feb 11, 2018

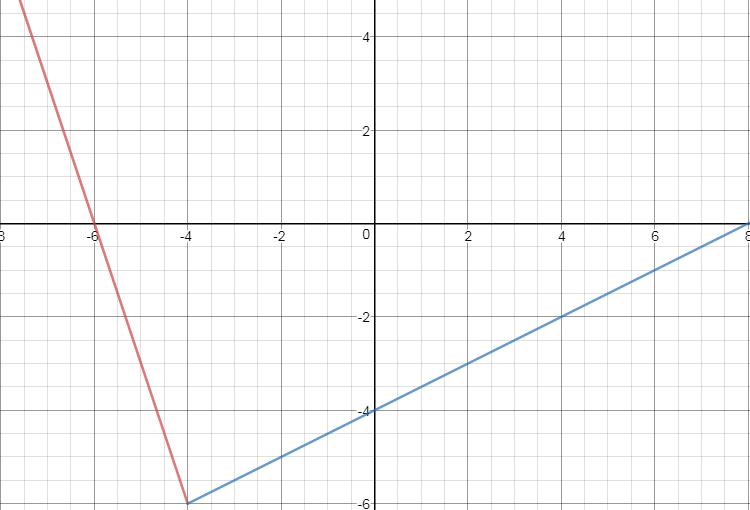
piecewise linear continuous

Explanation:

desmos.com/calculator

up to #x = -4# - but not at this point - the graph is drawn with the line #y = -3(x+6)#, or #y = -3x - 18#.

the #x#-intercept of this line is #(-6, 0)#. there is no #y#-intercept for this line, since it does not include a point where #x=0#.

at #x = -4#, and to the right of this. the graph is drawn with the line #y = 0.5(x-8)#, or #y = 0.5x - 4#.

the #x#-intercept of this line is #(8.0)#, and the #y#-intercept is #(0, -4)#.

the function is piecewise since it is defined by multiple sub-functions (in this case, 2).

in order to evaluate a piecewise function for a given value of #x#, the appropriate subdomain (e.g. #x<-4#) needs to be chosen.

this means that the correct function #f(x)# can be selected, to produce the correct #y#-value.

it is linear since it is composed of straight-line sections.

it is continuous since both functions that define it are also continuous, and there is no discontinuity at the endpoints of each one. (#x=-4# is defined here, using #y = 0.5(x-8)#.)