For every minute #M,# we get two photos #P.# IE, the amount of photos we have is always #2# times the amount of minutes passed.
Mathematically, we can represent this as
#P=2M#
At #0# minutes, #P=2(0)=0,# IE, we have no photos at zero minutes. So, this would be graphed as #(0,0).#
At #1# minute, #P=2(1)=2#. This would be graphed as #(1, 2)#.
At #2# minutes, #P=2(2)=4#. This is graphed as #(2,4).#
At any value of #M,# the plotted point is #(M, 2M).# Overall, the line has a slope of #2.#
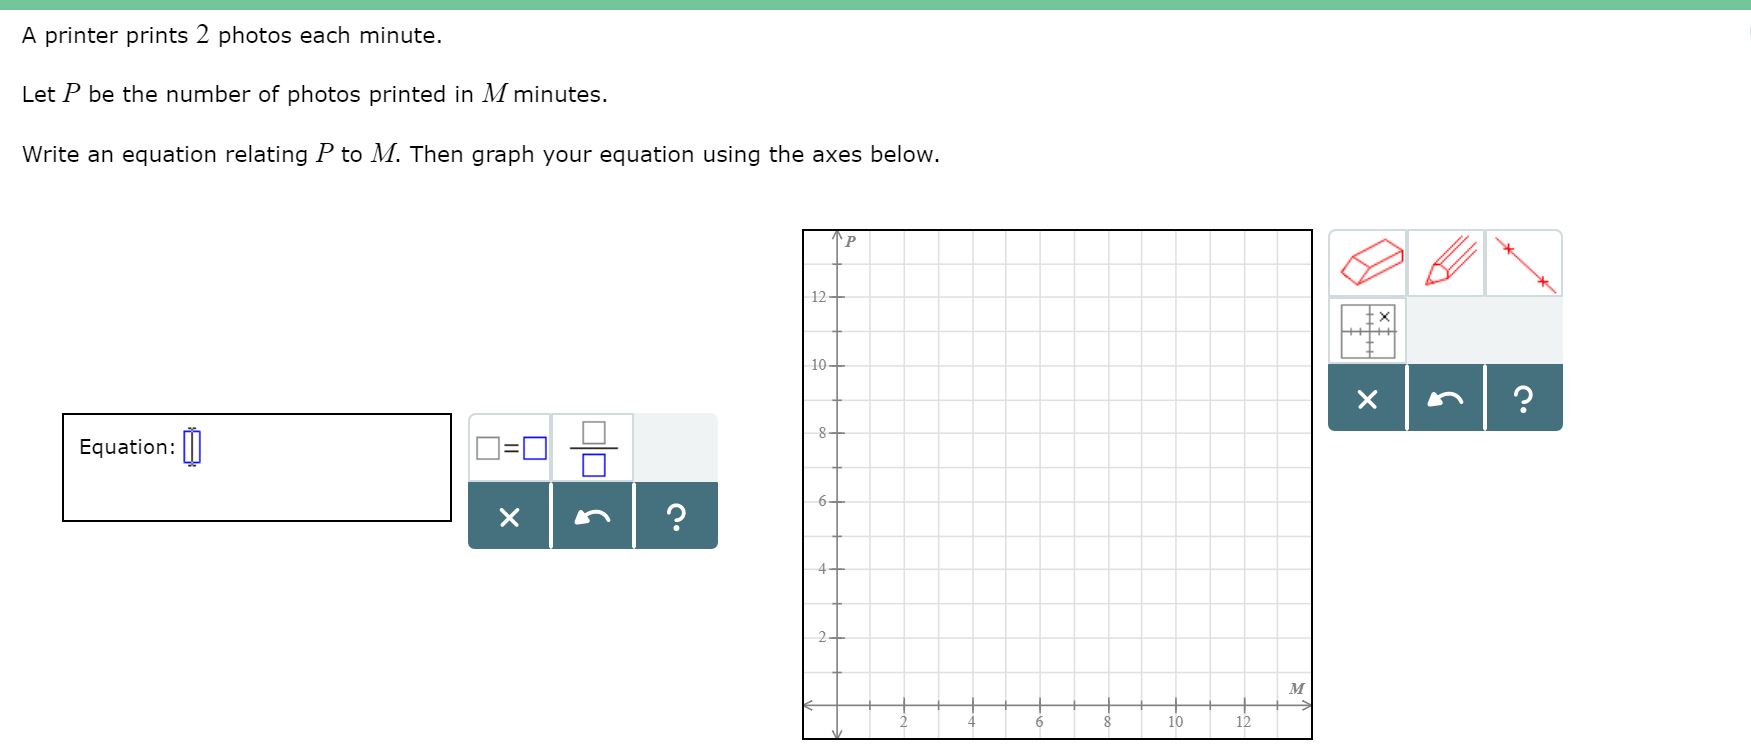
The graph would then look like this:
graph{y=2x [-10, 10, -5, 5]}