How do you graph #1/(2x)#?
1 Answer

Please see the explanation.
Explanation:
Given:
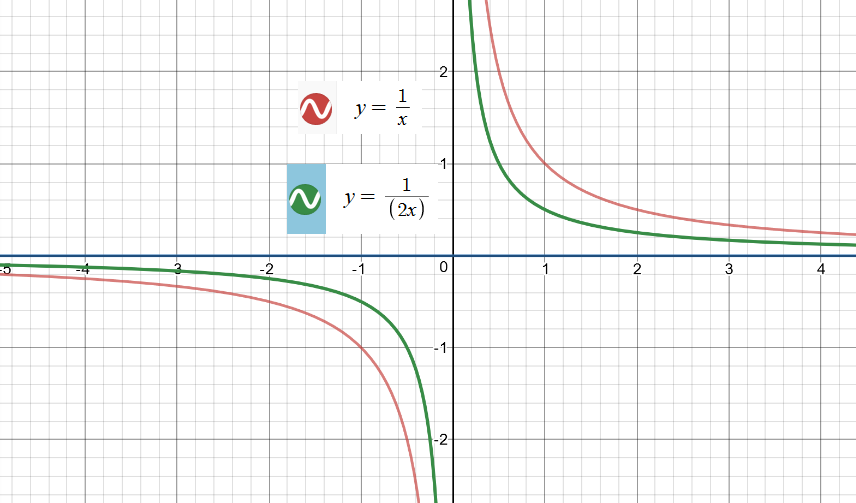
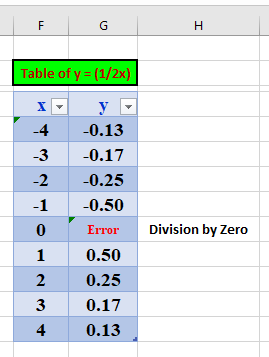
To graph this rational function, we can create a table of values.
The values of
Using
An image of the graph of the rational function
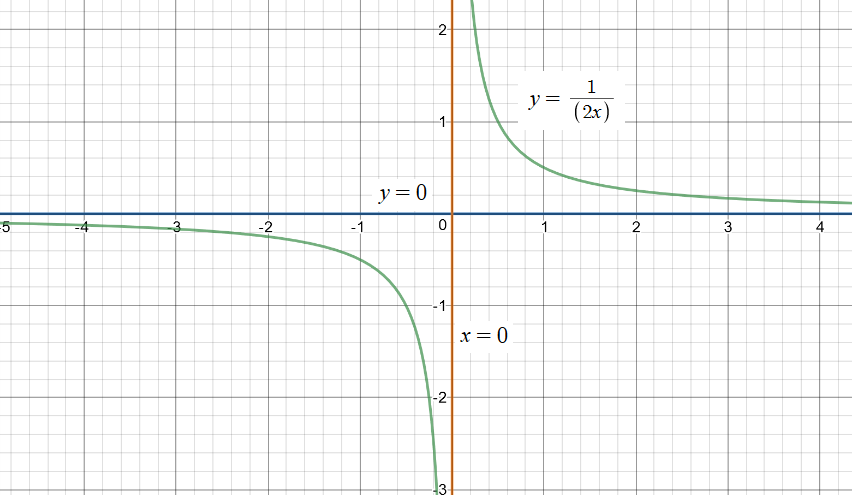
For rational functions the Vertical Asymptotes are the undefined points known as the Zeros of the denominator of the simplified rational functions.
In the graph above, we observe that the Vertical Asymptote is
Horizontal Asymptote:
The highest degree of the numerator = 0.
The highest degree of the denominator = 1.
Since the denominator’s degree > numerator's degree, the horizontal asymptote is the x-axis,
For the sake of clarity and better comprehension, the spreadsheet table below contains values for the parent function
One can compare both the tables to understand the behavior of the rational function
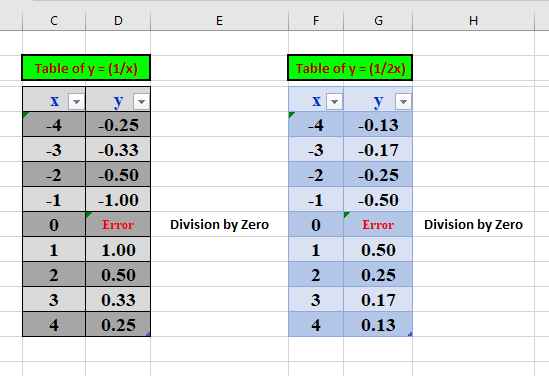
Using the table above, we can plot the points as an ordered pair