.
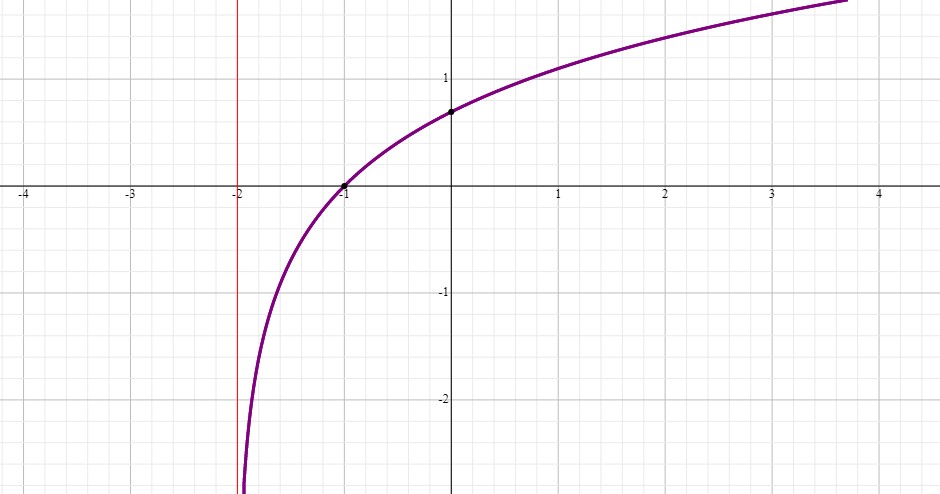
#g(x)=ln(x+2)#
When #x=0#, #g(x)=ln2#. You can see that is where the graph crosses the #y#-axis.
When #x=-1#, #g(x)=ln1=0#. You can see that is where the graph crosses the #x#-axis.
When #x=-2#, #g(x)= ln0#.
By definition, #y=lna# can be written in exponential form:
#e^y=a#
Therefore, if #g(x)=ln0# it means:
#e^(g(x))=0#
The only way this can be true is when #g(x)=-oo# because:
#e^(-oo)=1/e^oo=1/oo=0#
This means that when #x# approaches #-2#, #g(x)# approaches #-oo# which means you have a vertical asymptote at #x=-2#
On the positive side, as #x# increases #g(x)# increases. When #x# goes to #oo# #g(x)# goes to #oo#.