How to Sketch the curve of this equation?

#r=2 sin9 theta#

1 Answer
Mar 31, 2018

Please see below.

Explanation:

.

#r=2sin(9theta)#

In order to graph this function, we need to calculate certain key points and their coordinates. This will progressively make the behavior of the graph of this function clearer.

We know that a #sin# function has a maximum of #1# and minimum of #-1#. Therefore,

#r_max=2(1)=2#

#r_min=2(-1)=-2#

If we graph the function in a cartesian coordinate system we can make the #x#-axis #theta# axis and the #y# axis #r# axis. In this representation, #+-2# would be the amplitude of the function.

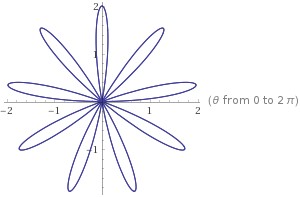
If we graph it in a polar coordinate system, #+-2# would be the maximum and minimum radii of the graph.

A #sin# function has a period of #2pi#. We divide #2pi# by the coefficient of the angle #theta# in our function to find the period of our function:

#Period =(2pi)/9#

This means the function completes one cycle within #(2pi)/9# radians.

#r=0, :. sin(9theta)=0, :. 9theta=0, +-kpi, :. theta=0, +-(kpi)/9#

These are the #x#-axis intercepts or #theta#-axis intercepts. In a polar coordinate system, these are the values of #theta# when the graph goes through the origin, i.e., the radius #r# collapses down to #0#.

These are at the same time the #y#-intercepts or #r#-intercepts of the function because when #theta=0# #r# becomes #0# which happens three times within each period.

The graph of this function in a cartesian coordinate system is:

enter image source here

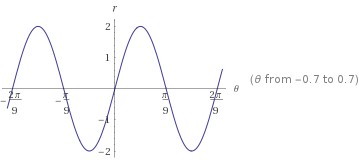
This is drawn for two periods of the function.

The graph of this function in a polar coordinate system is:

enter image source here