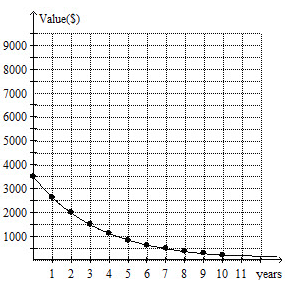
I don't really understand how to do this, can someone do a step-by-step?: The exponential decay graph shows the expected depreciation for a new boat, selling for 3500, over 10 years. -Write an exponential function for the graph -Use the function to find
1 Answer

Apr 9, 2018
Explanation:
I can only do the first question since the rest was cut off.
We have
Based on the graph we seem to have
