.
#y=(x-1)(x-2)(x+3)#
We set #y=0# to find the #x#-intercepts.
#(x-1)(x-2)(x+3)=0#
#(1,0), (2,0), and (-3,0)# are the #x#-intercepts.
We set #x=0# to find the #y#-intercept.
#(0,6)# is the #y#-intercept
This is a cubic function, i.e. it has #x^3# in the function.
Let's take its derivative, set it equal to #0#, and solve for #x# to find the minimum and maximum points of the function:
We multiply the three terms in the function together to remove the parentheses:
#y=x^3-7x+6#
#dy/dx=3x^2-7#
#3x^2-7=0, :. x=+-sqrt(7/3)#
We plug these into the function to find the #y# coordinates of the points:
#x=sqrt(7/3)=1.53, :. y=(sqrt(7/3))^3-7sqrt(7/3)+6=-1.13#
#x=-sqrt(7/3)=-1.53, :. y=(-sqrt(7/3))^3-7(-sqrt(7/3))+6=13.13#
#(1.53,-1.13),# is the absolute minima
#(-1.53,13.13)# is the absolute maxima
We can take the second derivative of the function, set it equal to #0#, and solve for #x# to find the inflection point:
#(d^2y)/dx^2=6x#
#6x=0, :. x=0#
#(0,6)# is the inflection point of the function in addition to being the #y#-intercept we found earlier.
Let's graph the function:
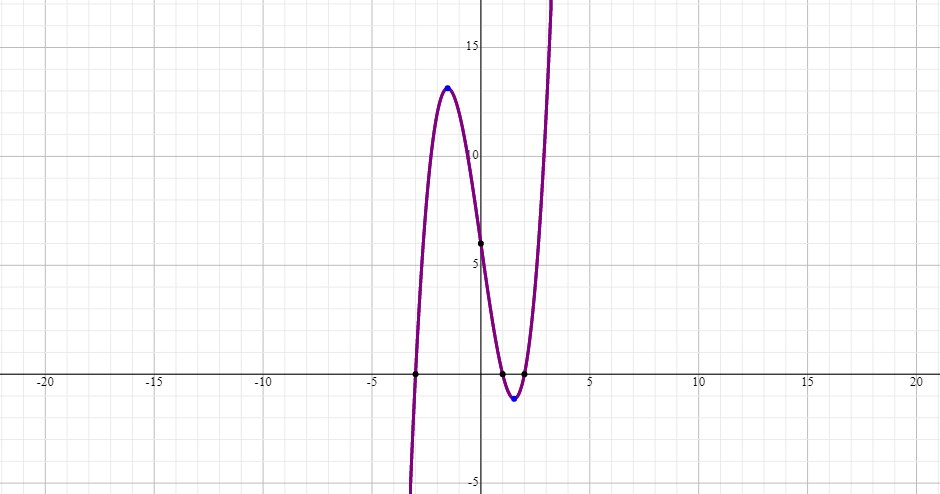
You can visually identify all the critical points we calculated.