Which of the following graphs represents the velocity distribution of nitrogen molecules at 800K?
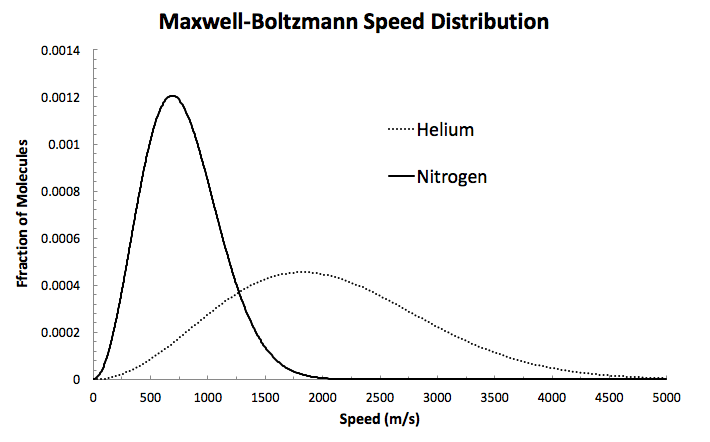
The graph below represents the velocity distribution of helium atoms at 800 K. The molar mass of helium gas is 0.004 kg/mole. The molar mass of nitrogen gas is 0.028 kg/mole. Which of the following graphs represents the velocity distribution of nitrogen molecules at 800 K?
The graph below represents the velocity distribution of helium atoms at 800 K. The molar mass of helium gas is 0.004 kg/mole. The molar mass of nitrogen gas is 0.028 kg/mole. Which of the following graphs represents the velocity distribution of nitrogen molecules at 800 K?
1 Answer

There's an easy way to do it...
And since the speeds will in general be slower, to maintain the area under the curve, the speed distribution will also be more narrow.
Thus, we expect
To prove it, I'll generate a graph of the Maxwell-Boltzmann distribution for
#f(v) = 4pi (m/(2pik_BT))^(3//2)v^2e^(-mv^2//2k_BT)#
I'll plot the speed of
#m_(He) = "4.0026 g"/"mol" xx "1 mol"/(6.0221413 xx 10^23 "particle") xx "1 kg"/"1000 g"#
#= 6.646 xx 10^(-27) "kg"#
#m_(N_2) = "28.014 g"/"mol" xx "1 mol"/(6.0221413 xx 10^23 "particle") xx "1 kg"/"1000 g"#
#= 4.652 xx 10^(-26) "kg"#
Here we have also that