Question #2c99c
1 Answer
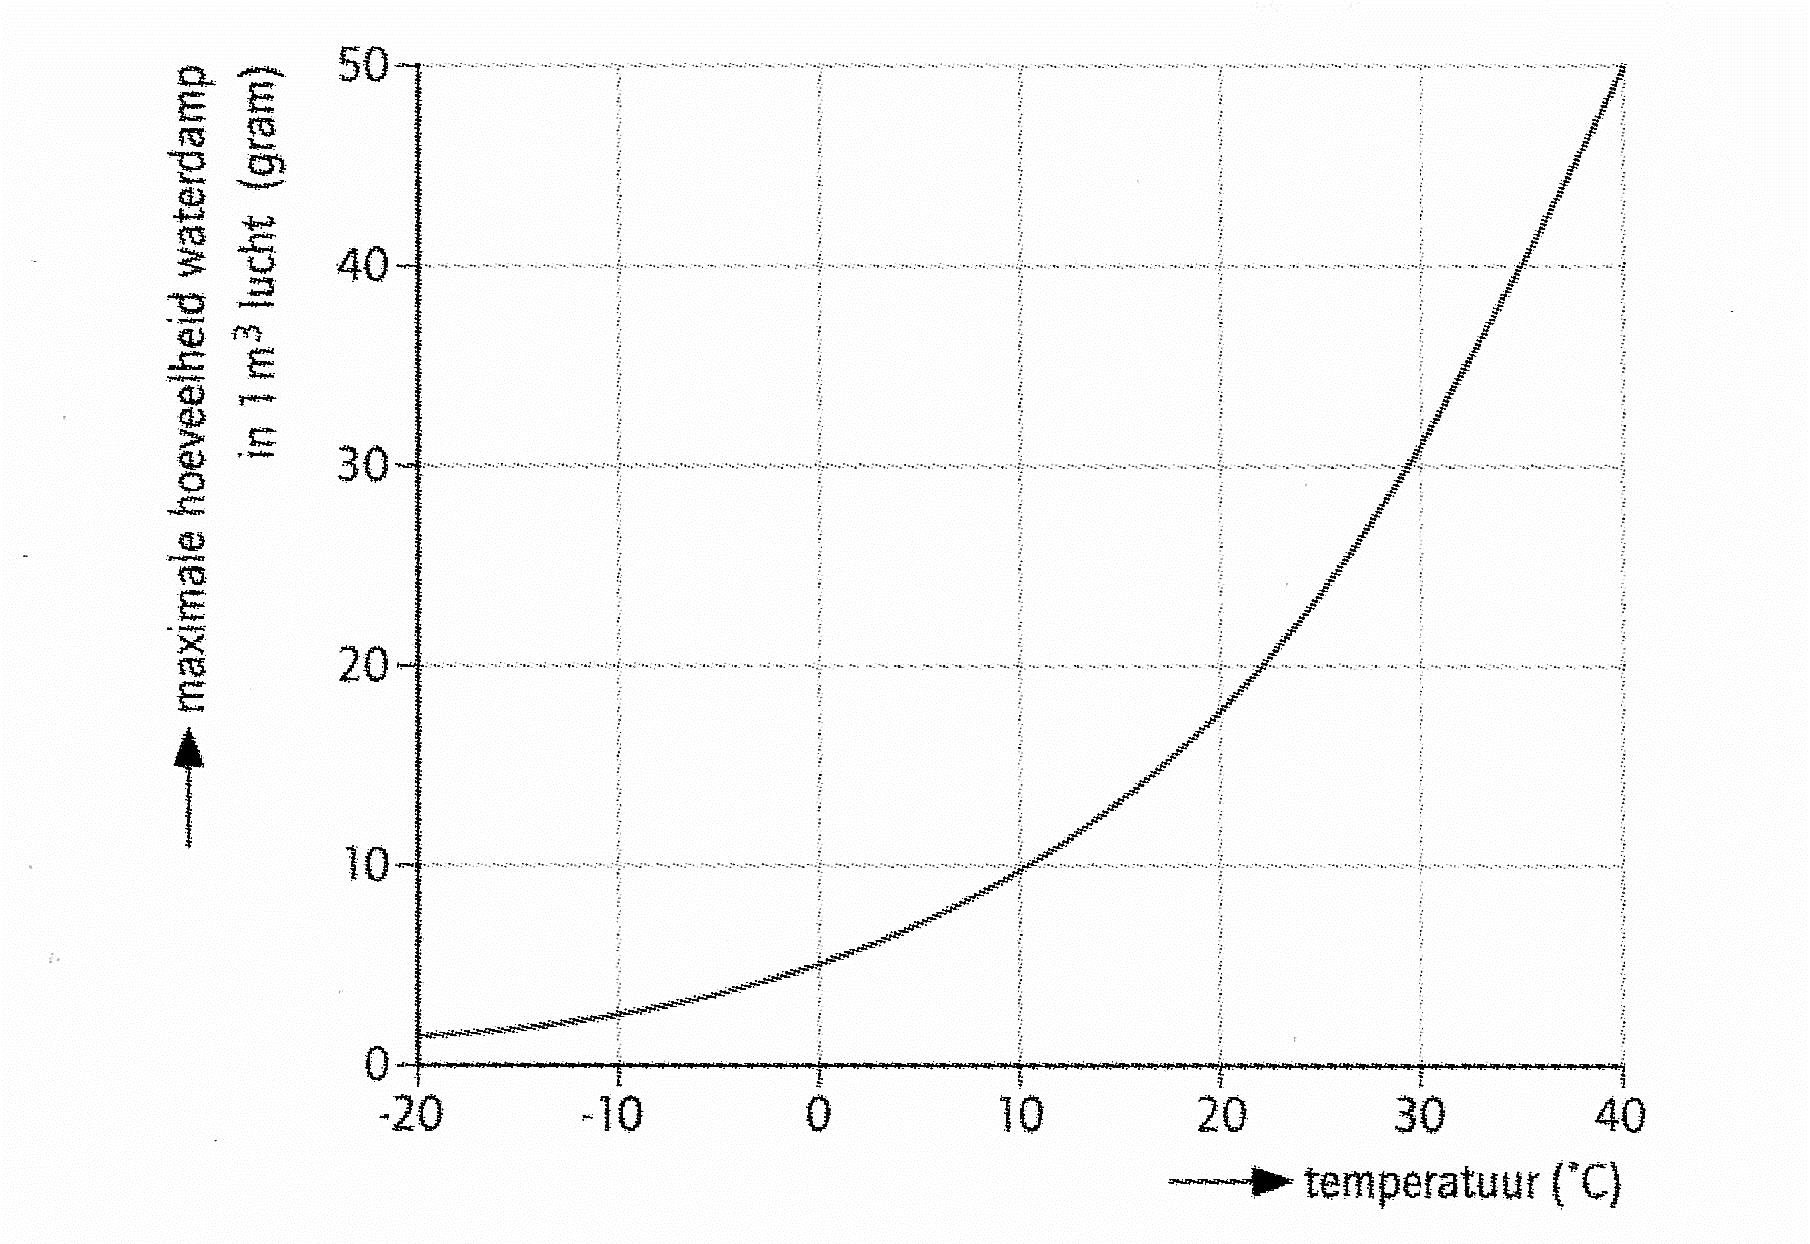
This can be best explained by the following graph. It's in Dutch, but the horizontal axis reads temperature (in degree Celsius), and the vertical axis gives the maximum amount of water vapour (in grams per cubic meter of air)

Remember: cooling is moving horizontally to the left, until you hit the graph. That's were condensation ('dewing') begins. Normally you never get to the left of the graph.
We now return to your question, in which we have to work the other way around:
-
The dewpoint is 20 degC. This means that there is 17 g/m3 in the air, because that is the maximum at 20 degC. You can read this from the graph.
-
17 g/m3 = 57% of the maximum at the ambient temperature.
The maximum is thus:#17/57*100~~30# g/m3 -
Read the graph the other way around. To 30 g/cm3 'belongs' a temperature of 29 degC.

