Question #6f7ed
1 Answer

Oct 15, 2015
Patricia - first "normalize" the data, then use a Standard Normal Table to find t.
Explanation:
Now, look up in a Standard Normal Table the area under the curve from 0 to z such that the area is equal to 0.148.
z = 0.380
Now, solve for t:
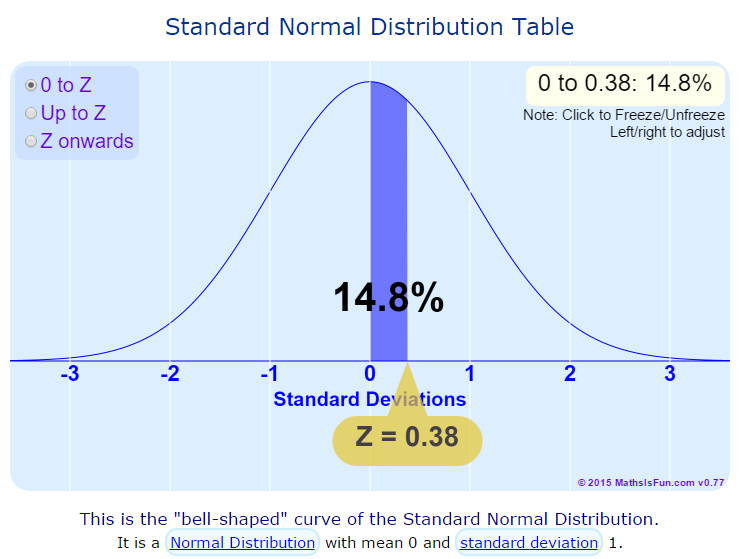
Source: http://www.mathsisfun.com/data/standard-normal-distribution-table.html
Hope that helped
