Question #44bee
1 Answer
Jun 16, 2016
I tried this:
Explanation:
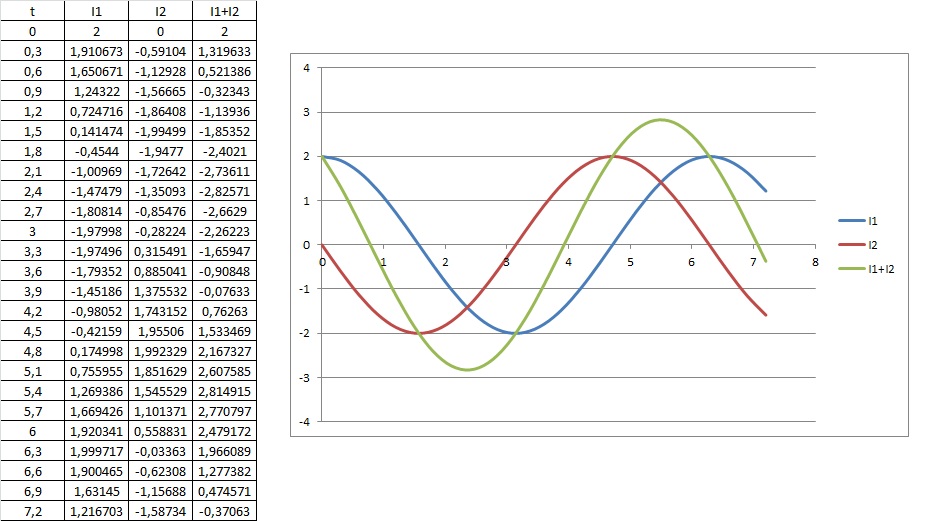
I used Excel to plot the various components with the data from the table:

The green line will be the superposition of the original waveforms.
Hope it helps.

