Question #da0c9
1 Answer
Graph added.
Estimated Boiling point of acetone
Explanation:
The normal boiling point is the temperature in which the vapour pressure of a liquid becomes equal to atmospheric pressure.
Normal atmospheric pressure is defined as 1 atmosphere.
In the given data value of temperature at 1 atmosphere has not been given, therefore,
- You need to plot a smooth line graph using the given data.
- Interpolate# the value of temperature at 760 torr of pressure.
- State this temperature as the boiling point of acetone.
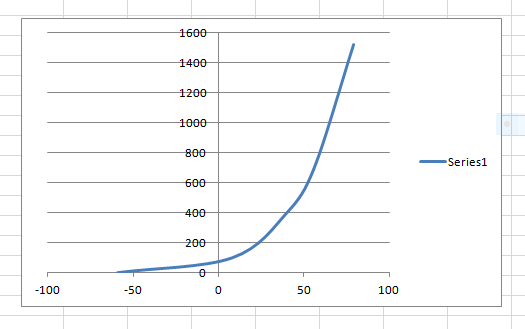
#Alternative method for estimating Boiling Point of acetone from the graph.
We observe that the portion of the graph from pressure of 700 torr to 1520 torr can be best described as a straight line. As such, we can mathematically interpolate the value of temperature at pressure of 760 torr, as follows.
Change in pressure between the two
Change in temperature between the two
We need to estimate Change in pressure between
We have change in temperature as
-.-.-.-.-.-.-.-.-.-.-.-.-.-.-.-.-.-.
Published BP of acetone is
The difference can be attributed to
1. Error due to interpolation. To reduce this error may readings are taken near the expected value.
2. Error of measurement of data
3. Impurities in the acetone sample tested.
