Question #802ea
1 Answer
Apr 23, 2017
Here's a different function
Explanation:

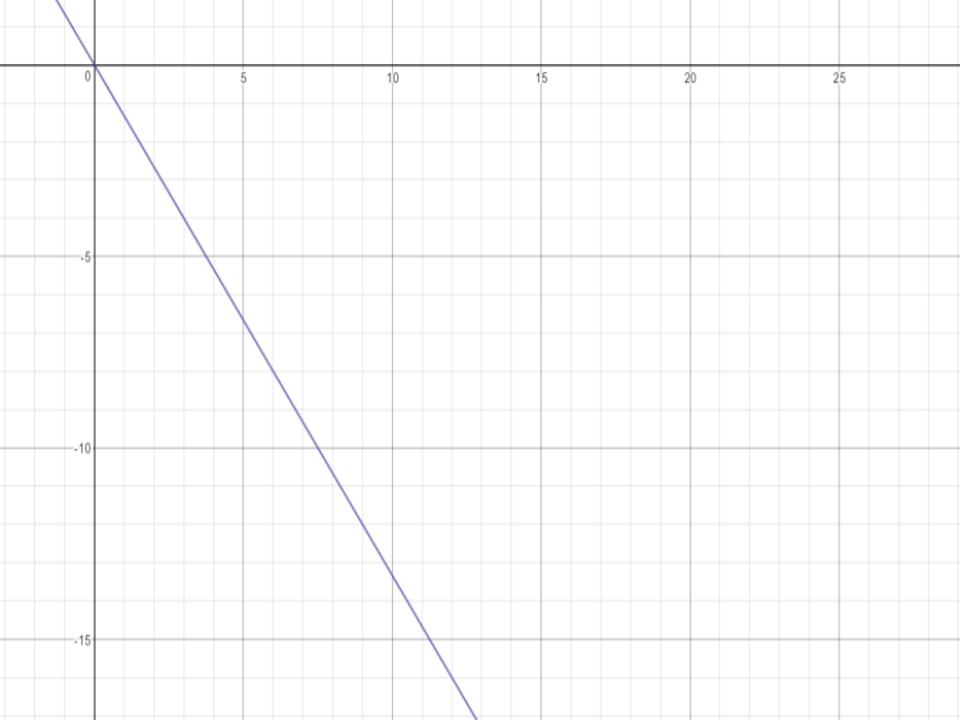
Let's say that this is the graph of f(x) for x from -1 to 13 or so.
If I ask you for the value of f(0), I'm asking for the value of this function when x is 0 (i.e. I'm asking for the y value at the given x point). Here, f(0)=0.
If I ask for f(3), you should look at the function where x=3 (here, I haven't labelled my axes, but x is horizontal as usual). The value of the function at x=3 is -4, so f(3)=-4.
Similarly, f(6)=-8, and f(5)=-6.6 or so.
(if we had the equation of this function we could find the exact values at these points, but if we only have a graph, we're stuck making our best guess from what we can see)

