Question #90fa7
1 Answer
As explained below
Explanation:
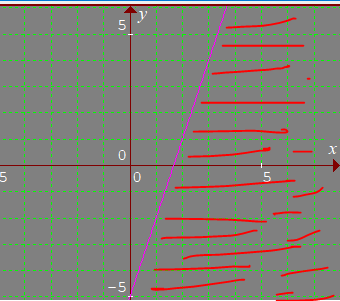
First graph the line y=3x-5. Now determine by visual inspection whether point (0,0) is on the left or right of the line. Now put x=0,y=0 in the expression y< 3x-5. This gives 0<-5, which is not true. This enables us to conclude that the region of inequality does not contain (0,0). Hence the region of inequality would be on the other side of the line which does not contain(0,0) This is shown in red shade in the figure below.

Now, in the graph make the line y=3x-5 as a dotted line, to empasise that points on the line are not part of the given inequality.**
