Question #aa462
1 Answer

Dec 16, 2017
As shown below:
Explanation:
The first thing to consider what
graph{lnx [-4.58, 15.42, -4.2, 5.8]}
So hence
graph{ln(4x) [-5.29, 14.71, -3.8, 6.2]}
With the same asymptote of
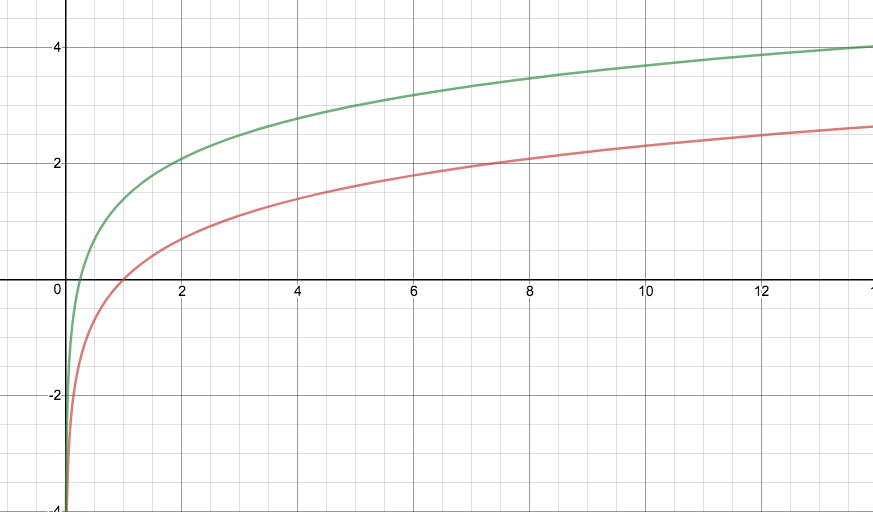
Green -
Red -
It is also the graph of
