Question #e3d2a
1 Answer
The I.C.E. Table
Explanation:
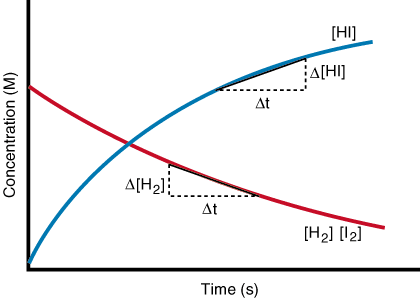
Consider the hypothetical reaction Reactants (R) => Products (P). A plot of concentration vs time gives a graphic as follows

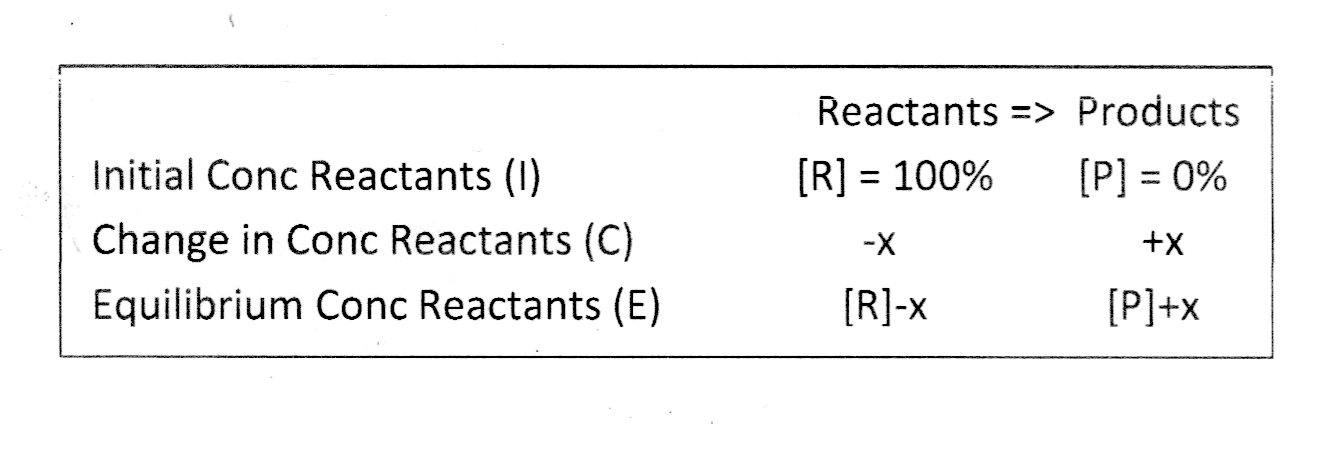
Applying this to the I.C.E. table, think of the concentrations before reaction starts as being like horses at the starting gate of a race. Before the gates open (i.e., before reaction starts) there are no products; it's all reactants at this point and zero products. Then imagine opening the gates and letting the horses run (i.e., products are being produced from reactants). It is a logical progression that the reactant concentration will simply decrease and the product concentrations increase until reaching a point of dynamic equilibrium where Rate of forward reaction = Rate of the reverse reaction.
Applying this to the I.C.E. table...

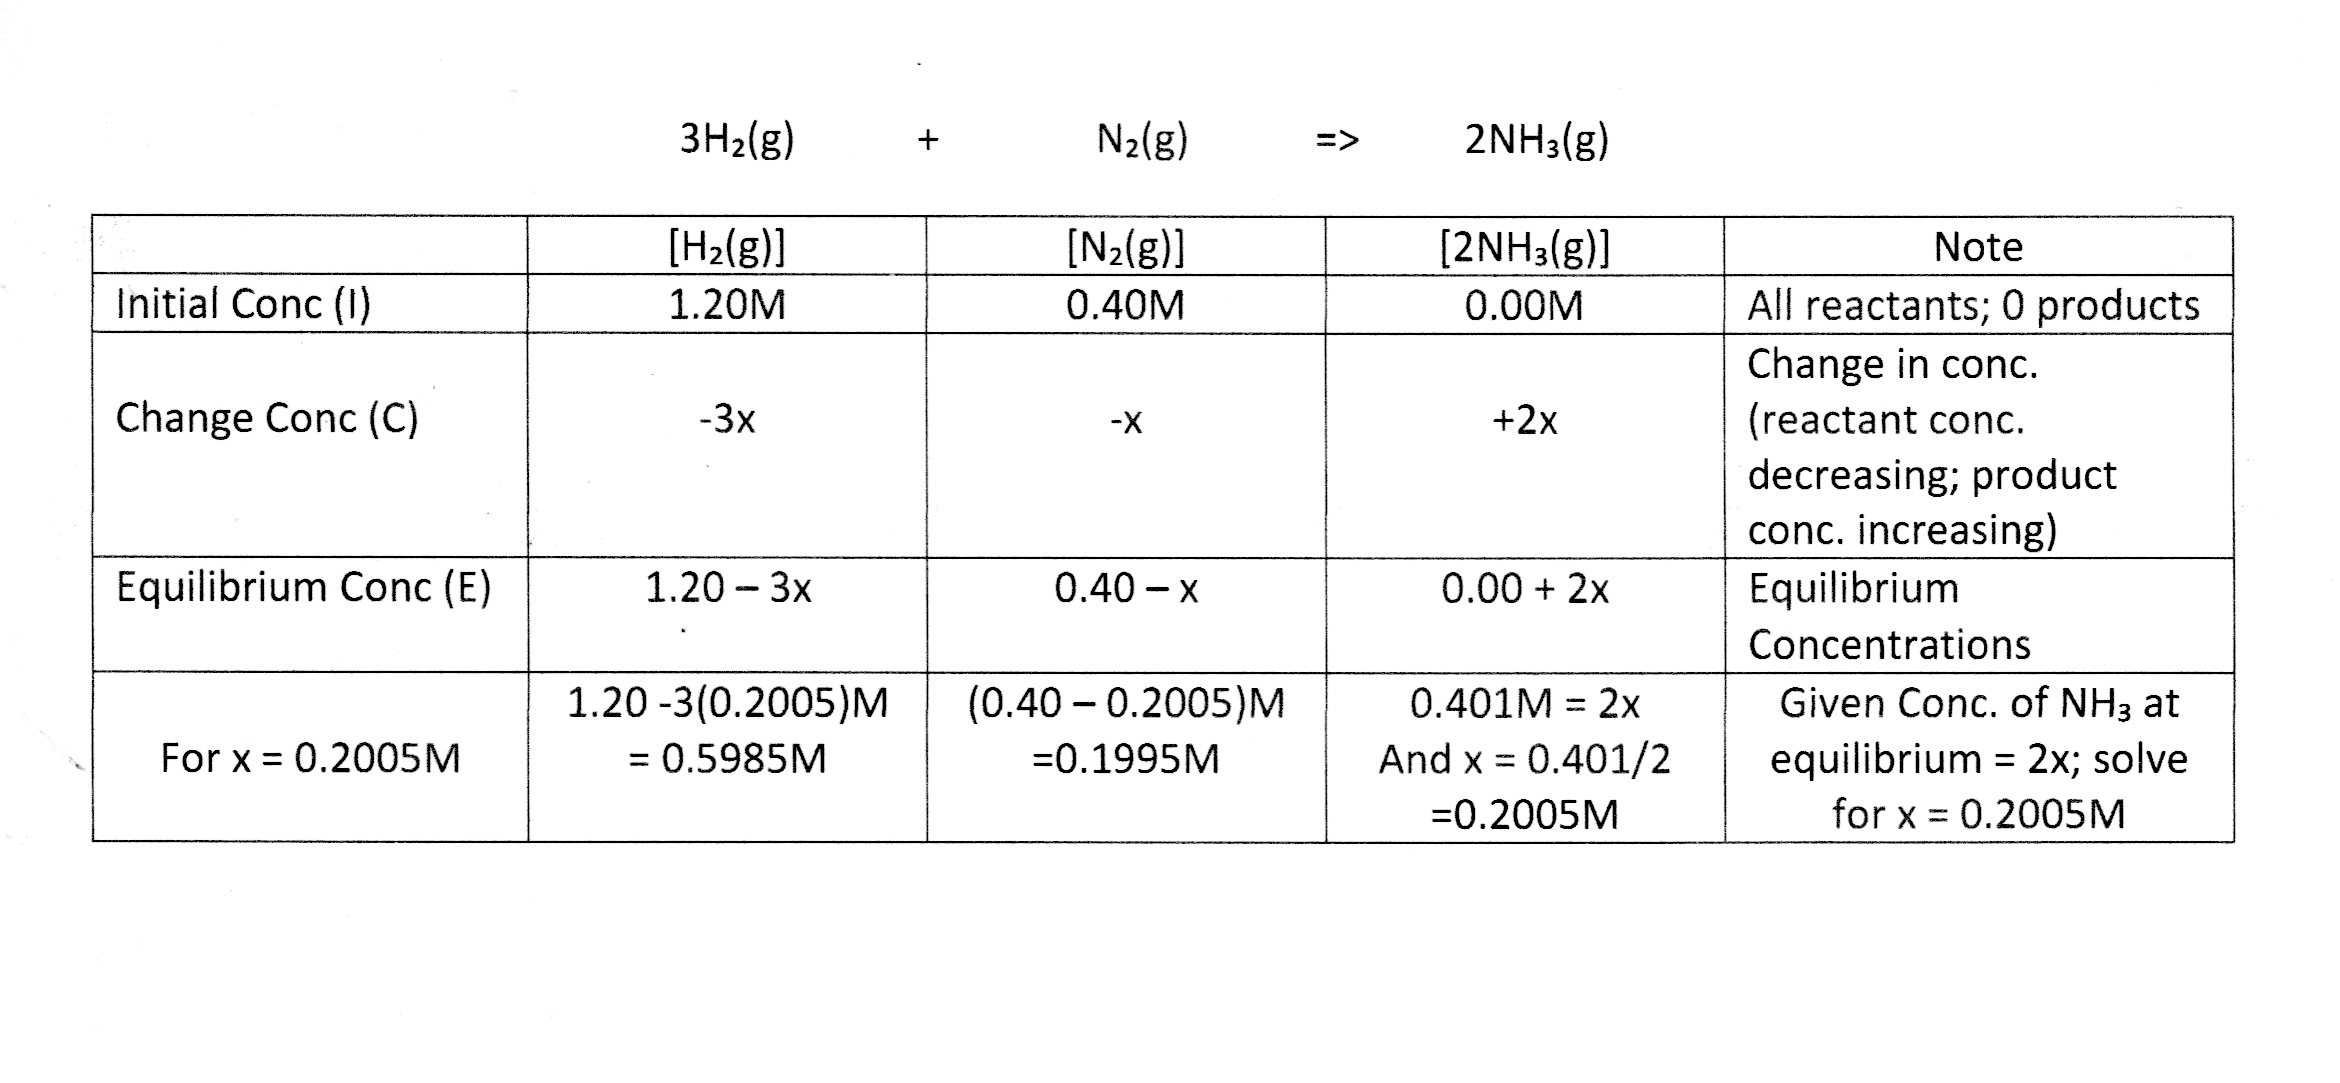
For your problem listed...

Hope this helps.

