Question #0732c
1 Answer

Warning! Long Answer. Here's what I get.
Explanation:
(a) pH at 1st and 2nd equivalence point
The equivalence points are the steepest points on the curve.
They are also the points at which the curvature of the graph changes from concave up to concave down.
They appear to be at 17.8 mL and 35.0 mL on the graph.
The 1st equivalence point is at about pH 4.3, and the 2nd equivalence point is at pH 9.0 (the two red dots on the graph).
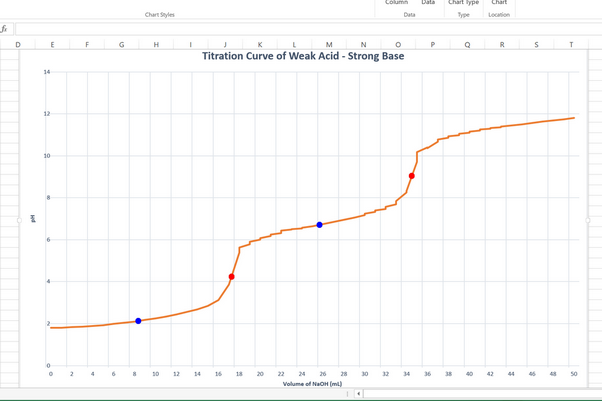
(b) The mid-point of each titration
The first titration goes from 0 mL to 17.8 mL, so the midpoint is at 8.9 mL.
The second titration goes from 17.8 mL to 35.0 mL, so the midpoint of the second titration is at 26.1 mL.
(c) Evaluating
You are titrating a weak diprotic acid
In the first titration, you are converting
The equilibrium is
#"H"_2"A + H"_2"O" ⇌ "H"_3"O"^"+" + "HA"^"-"#
The Henderson-Hasselbalch equation gives the
At the mid-point of the titration, you have neutralized half the
In the second titration, you are converting
The equilibrium is
#"HA"^"-" + "H"_2"O" ⇌ "H"_3"O"^"+" + "A"^"2-"#
The Henderson-Hasselbalch equation gives the
At the mid-point of the second titration, you have neutralized half the
These are the blue dots on the graph.
It looks as if
(d) Calculating
∴
Also,
∴
