Given:
#color(brown)(f(x) = |x|)#
#color(brown)(h(x) = 2*|x|+2)#
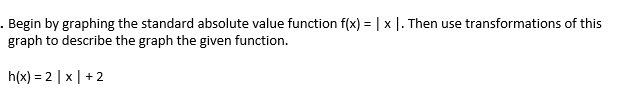
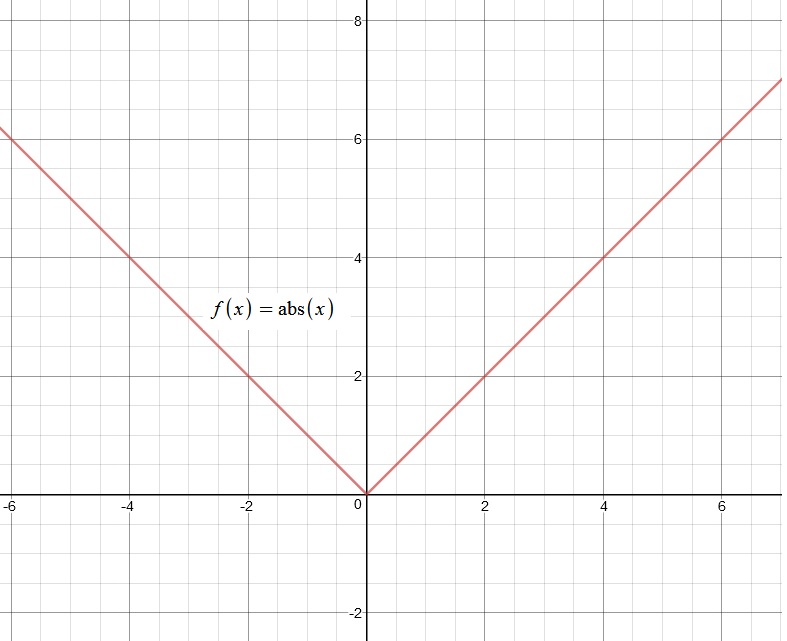
Our Parent Function is #color(brown)(y=f(x) = |x|)#
Let us know focus on how the transformation
#color(brown)(h(x) = 2*|x|+2)#
will affect our Parent Graph given below:
Our function #color(brown)(h(x) = 2*|x|+2)# has a general format:
#color(blue)(y= f(x)= +-a*|x|+b)#
If, #color(green)(a>1)#, then the graph will go through a Vertical Stretch.
If, #color(green)(0 < a < 1)#, then the graph will go through a Vertical Compression.
If, #color(green)(" "b" " is" " Positive#, then the graph will shift up buy #b# units.
If, #color(green)(" "b" " is" " Negative#, then the graph will shift down buy #b# units.
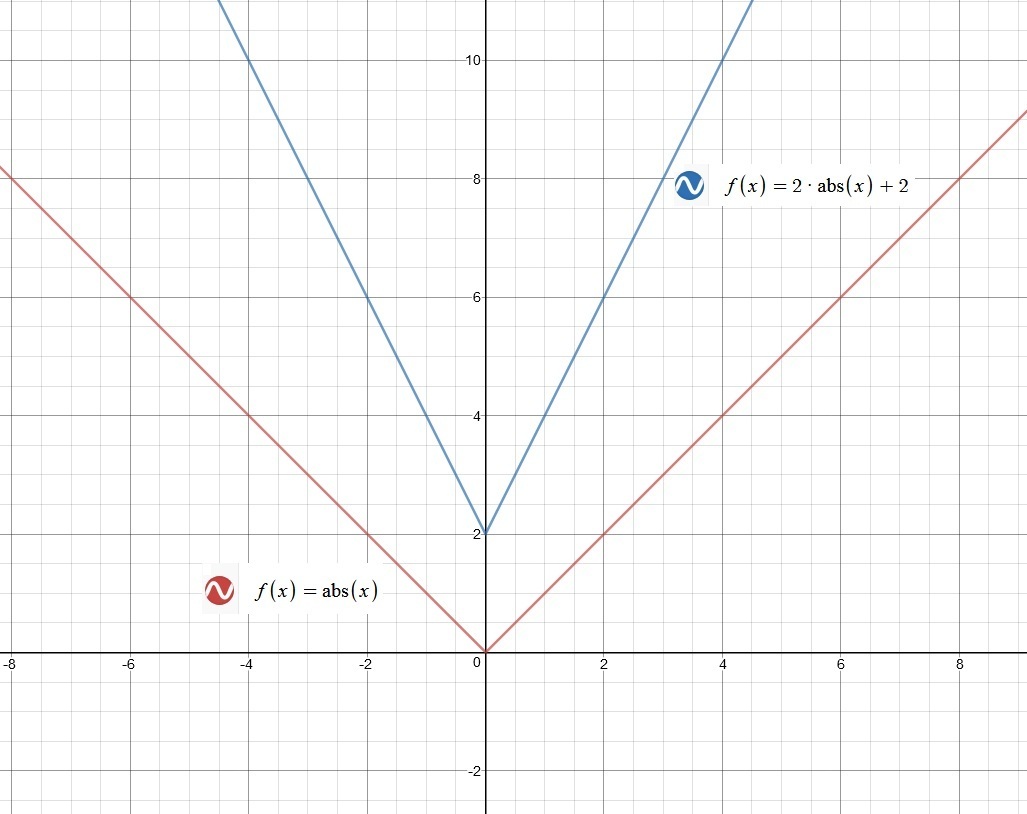
Analyze the graph below to observe how the transformation
#color(brown)(h(x) = 2*|x|+2)#
is affecting our Parent Graph: