Can someone help me answer this question about melting of crystalline solids? Thanks!
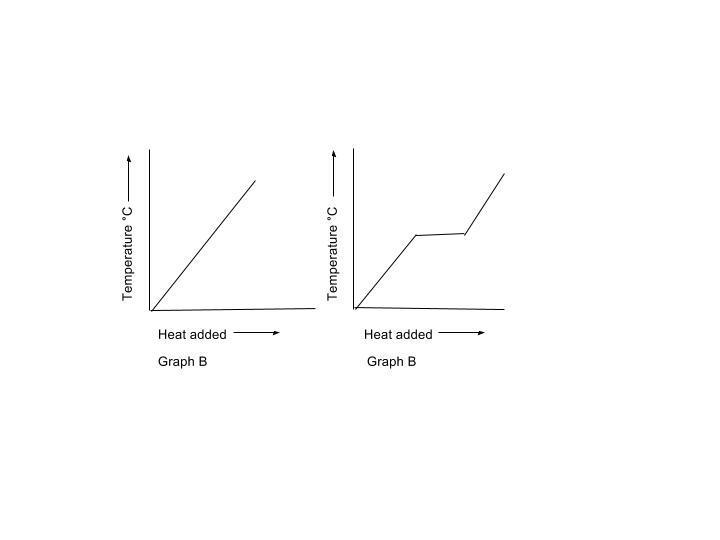
- Which graph shows the melting of crystalline solids? Explain your reasoning.
- What type of solid does the other graph show? Explain.
- Which graph shows the melting of crystalline solids? Explain your reasoning.
- What type of solid does the other graph show? Explain.
1 Answer
The rightmost graph (as we face the page) is the one that specifies the melting point of a crystalline solid....
Explanation:
When a material reaches fusion point, there is a phase equilibrium...
While the solid and liquid phases are BOTH at the same temperature, energy has to be supplied to effect the phase transition....the so-called
Crystalline materials tend to have sharply defined melting points, and this is one reason we quote melting points as a means to identify unknown organic derivatives.
The leftmost graph represents the heating of a gas or a liquid that is well-below its boiling point.... Just noticed that both graphs are labelled
