Can someone help me? Thanks!
1 Answer

Sep 3, 2017
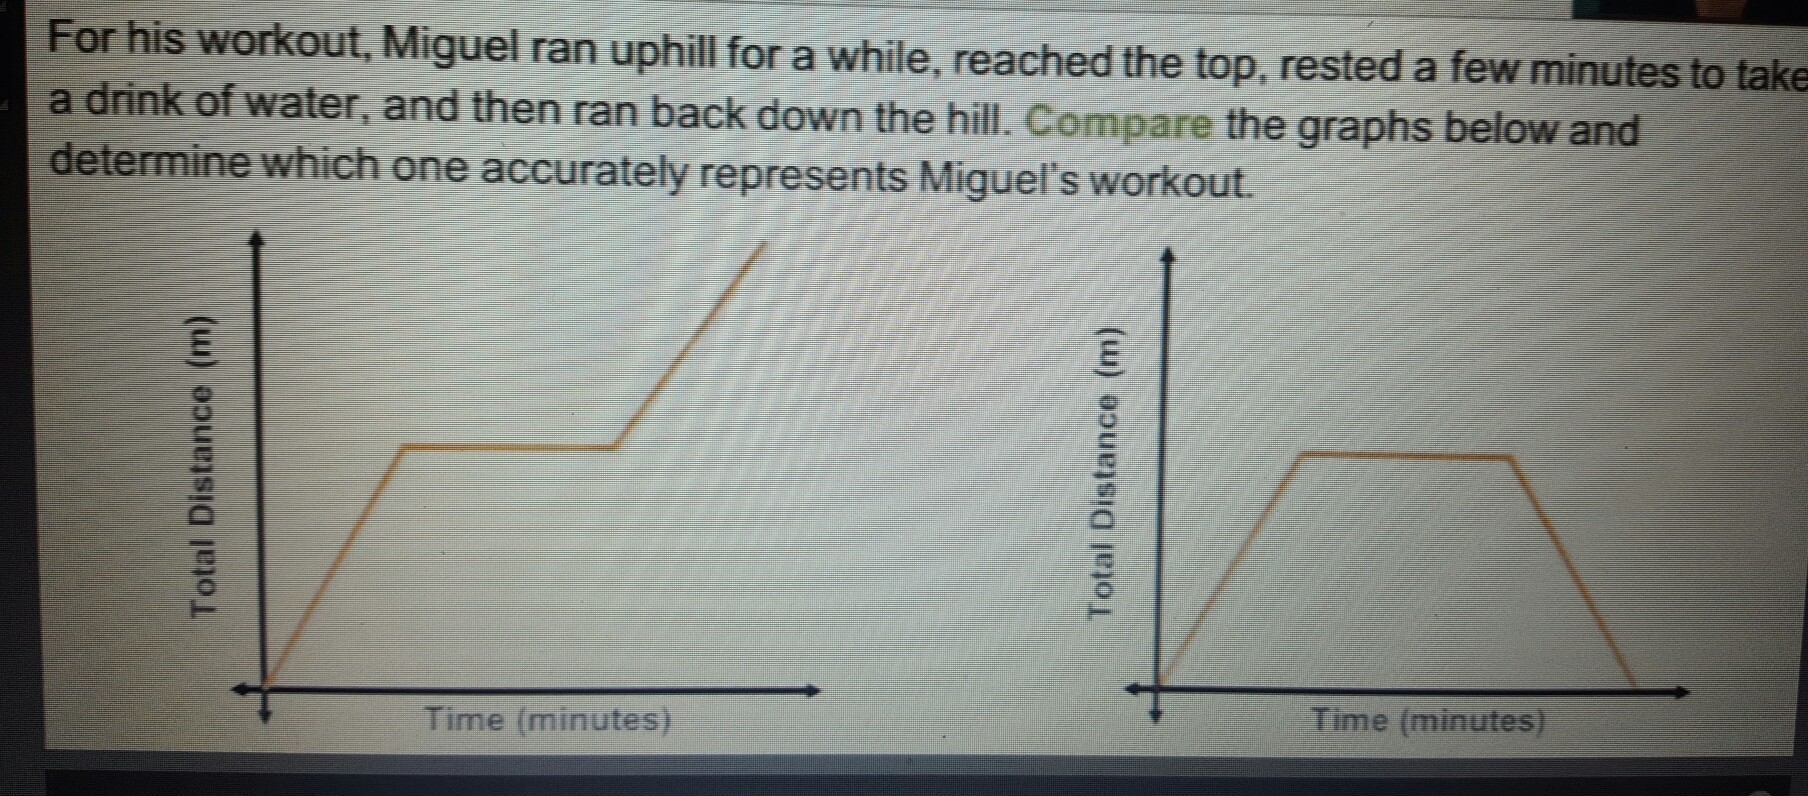
The graphs are supposed to depict the total distance Miguel ran. Therefore, after resting Miguel ran back the same distance down the hill he had run up the hill. Therefore he ran more distance.
The graph on the left depicts how far Miguel ran.
If you used the graph on the right it would show after running up hill, resting and running some more down hill Miguel had run a distance of
