a- Write the chemical equation
#"NaOH + HCl" → "NaCl" + "H"_2"O"#
b- Volume to reach equivalence point
#color(blue)(bar(ul(|color(white)(a/a)c_text(A)V_text(A)= c_text(B)V_text(B)color(white)(a/a)|)))" "#
#V_text(A) = V_text(B) × c_text(B)/c_text(A) = "50 mL" × (0.1 color(red)(cancel(color(black)("mol/L"))))/(0.2 color(red)(cancel(color(black)("mol/L")))) = "25 mL"#
The equivalence point is at 25 mL #"HCl"#.
c- pH during titration
(i) At 0 mL
#["OH"^"-"] = "0.1 mol/L"#
#"pOH" = "-log"(0.1) = 1.00#
#"pH = 14.00 - pOH = 14.00 - 1.00 = 13.00"#
(ii) pH at 10 mL
#"Initial moles of NaOH" = 0.050 color(red)(cancel(color(black)("L NaOH"))) × ("0.1 mol NaOH")/(1 color(red)(cancel(color(black)("L NaOH")))) = "0.0050 mol NaOH"#
#"Moles of HCl added " = 0.010 color(red)(cancel(color(black)("L HCl"))) × "0.2 mol HCl"/(1 color(red)(cancel(color(black)("L HCl")))) = "0.0020 mol HCl"#
#"Moles of NaOH remaining = (0.0050 - 0.0020) mol NaOH = 0.0030 mol NaOH"#
#"Volume = (50 + 10) mL = 60 mL = 0.060 L"#
#["OH"^"-"] = "0.0030 mol"/"0.060 L" = "0.050 mol/L"#
#"pOH = -log(0.050) = 1.30"#
#"pH = 14.00 - 1.30 = 12.70"#
(iii) pH at 25 mL
You are at the equivalence point, so #"pH= 7.00"#.
(iv) pH at 30 mL
You are 5 mL past the equivalence point, so you have neutralized all the #"NaOH"# and have a solution of excess #"HCl"#.
#"Excess moles HCl " = 0.005 color(red)(cancel(color(black)("L HCl"))) × "0.2 mol HCl"/(1 color(red)(cancel(color(black)("L HCl")))) = "0.0010 mol HCl"#
#"Volume = (50 + 30) mL = 80 mL = 0.080 L"#
#"[HCl]" = "0.0010 mol"/"0.080 L" = "0.012 mol/L"#
#"pH = -log(0.12) = 1.90"#
e- Construct the titration curve
Plot the points on a graph and draw a smooth curve between them.
Your graph should something like this.
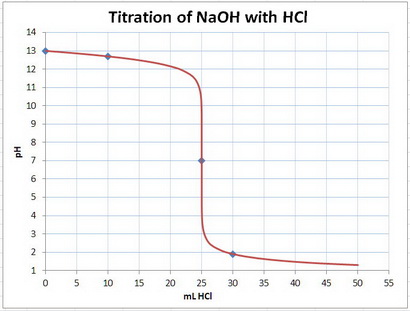
Your points are marked by the blue diamonds.
f- Detect the end point from the graph
The end point is the point where the curvature of the graph changes from concave down to concave up.
This is at 25 mL and pH 7.


