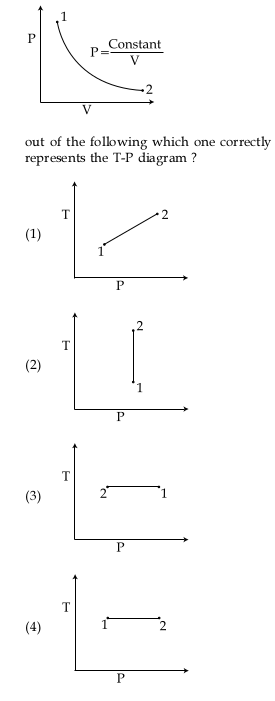
For the P-V diagram given for an ideal gas, the T-P graph is=?

enter image source here

2 Answers
Mar 28, 2018

3)

Explanation:

The curve is an isotherm #PV=" constant"#. So, it must be a horizontal line on a #T-P# diagram. Among the two valid options, 3) is the one that shows that state marked 2 has a lower pressure, as it should.

Mar 28, 2018

#(3)#

Explanation:

The ideal gas law is: #PV=nRT# in your exercise is #T=const. rArr PV=const.#
If we write #T=(PV)/n# and consider #PV=const.# we can conclude that #T=const.# So #(1),(2)# can not be the answer.

Look at the #P-V# diagram: #P_1>P_2# the only #T-P# diagram that maintain this feature is #(3)#.