Frequency question?
2 Answers

Jan 10, 2018
Explanation:
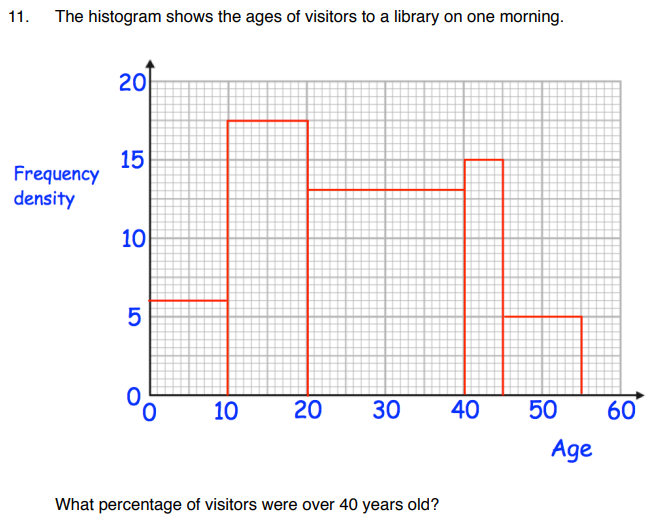
For a histogram it is the AREA of the bars that measures the actual frequency.
So the first task is to calculate the frequency for each interval
Total
Those over
Jan 11, 2018
see below
Explanation:
to explain the last part more clearly:
the data has been put into a table
we need the % of visitors over 40.
from the table we see that the last two rows of the data give us those over 40
namely
so the total number of visitors over 40
to find the % over 40 we compare this with the total and multiply by 100 to
