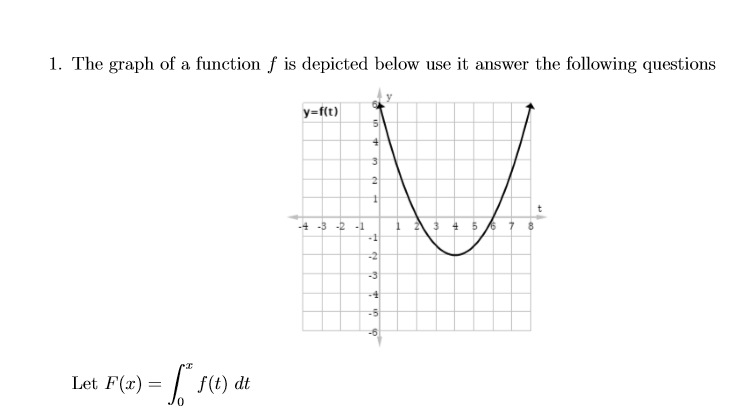
Given this graph of #f# where does #F# have a local min/max and find the intervals where #F# is concave up/down?

enter image source here

1 Answer
May 25, 2017

Explanation:

So we are looking at a graph of the derivative of #F(x)#.

Where the derivative is positive, the graph of the derivative is above the #x# axis and #F# is increasing.
Where the derivative is negative, the graph of the derivative is below the #x# axis and #F# is decreasing.

So #F# has a relative maximum at #x=2# (where the derivative of #F# changes from + to -).
and #F# has a relative minimum at #x=6# (where the derivative of #F# changes from - to +).

(The graph of) #F# is concave up where #F''(x)# is positive and that happens where #F'(x)# is increasing. We can see on the graph that that happens for #x > 4#.

Dually, the graph of #F# is concave down where the derivative of #F# is decreasing. In this case, for #x < 4#.