How can I write down the function from the graph?
1 Answer

See explanation...
Explanation:
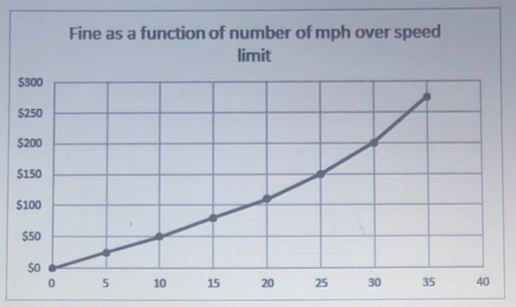
It looks like the graph passes through data points with approximate values:
((0, 0), (5, 25), (10, 50), (15, 80), (20, 110), (25, 150), (30, 200), (35, 275))
It is not clear from the graph whether these points are intended to be joined with straight line segments, indicating a piecewise linear function, or with a curve.
Since the sample points are at regular
Write down the sequence of
0, 25, 50, 80, 110, 150, 200, 275
Write down the sequence of differences between consecutive terms:
25, 25, 30, 30, 40, 50, 75
Write down the sequence of differences of those differences:
0, 5, 0, 10, 10, 25
Write down the sequence of differences of those differences:
5, -5, 10, 0, 15
That does not look like a pattern to me. Instead it looks like the function is intended to consist of linear segments.
The slope of each segment is given by dividing the rise by the run
5, 5, 6, 6, 8, 10, 15
We can treat the first couple of pairs of segments as single segments of length
f(x) = { (5x " if " 0 <= x < 10), (6x - 10 " if " 10 <= x < 20), (8x - 50 " if " 20 <= x < 25), (10x - 100 " if " 25 <= x < 30), (15x - 250 " if " 30 <= x <= 35) :}
At each point where we start the next segment, we choose the offset to make the value of the function match the sample point. Then the slope we calculated takes care of the rest until the next segment.
Bonus
If you are not keen on these piecewise definitions, there is an alternative using the properties of
graph{x+abs(x) [-10.71, 9.29, -2.84, 7.16]}
We can use scaled and offset copies of this function added together to get our incrementally increasing slopes and define:
f(x) = 5x+1/2(x-10+abs(x-10))+(x-20+abs(x-20))+(x-25+abs(x-25))+5/2(x-30+abs(x-30))
graph{5x+1/2(x-10+abs(x-10))+(x-20+abs(x-20))+(x-25+abs(x-25))+5/2(x-30+abs(x-30)) [-5, 40, -35, 280]}
