How do I estimate the area under the graph of f(x) = sqrt x from x=0 to x=4 using four approximating rectangles and right endpoints?
1 Answer
graph{sqrt(x) [-5, 5, -2.5, 2.5]}
Look at the graph above.
Divide the interval into the correct number of equal pieces. In this case, the interval is [0,4], and their are 4 pieces. so:
That is, each interval should be 1 unit wide.
Another way of saying this would be that if I break the x-axis between 0 and 4 into 4 equal segments, each segment would be 1 unit long. (see the image below:
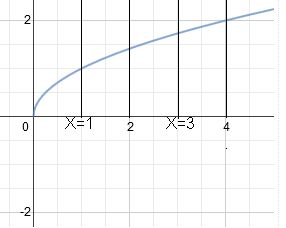
Now, the right endpoints are x=1, 2, 3, and 4.
(the left endpoints are x=0, 1, 2, and 3)
Making rectangles from those endpoints looks like this:
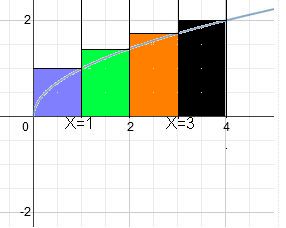
Now to find the area under the curve, using the rectangles is simply Area = Base * Height. In this case, the base of each rectangle is 1, and the height is
I'll let you do the math.
I will let you know these things, though (a quick look ahead):
1) Using the right side overestimates the area
2) Using the left side underestimates the area
3) using the middle is much closer, but is not exact, either
4) If you increase the number of rectangle while holding the interval of interest the same (say 1,000 rectangles from 0 to 4), it becomes more accurate.
5) the maximum number of rectangles is the limit of the number of rectangles
6) as the limit approaches infinity, the answer approaches exact, and is called an integral.
