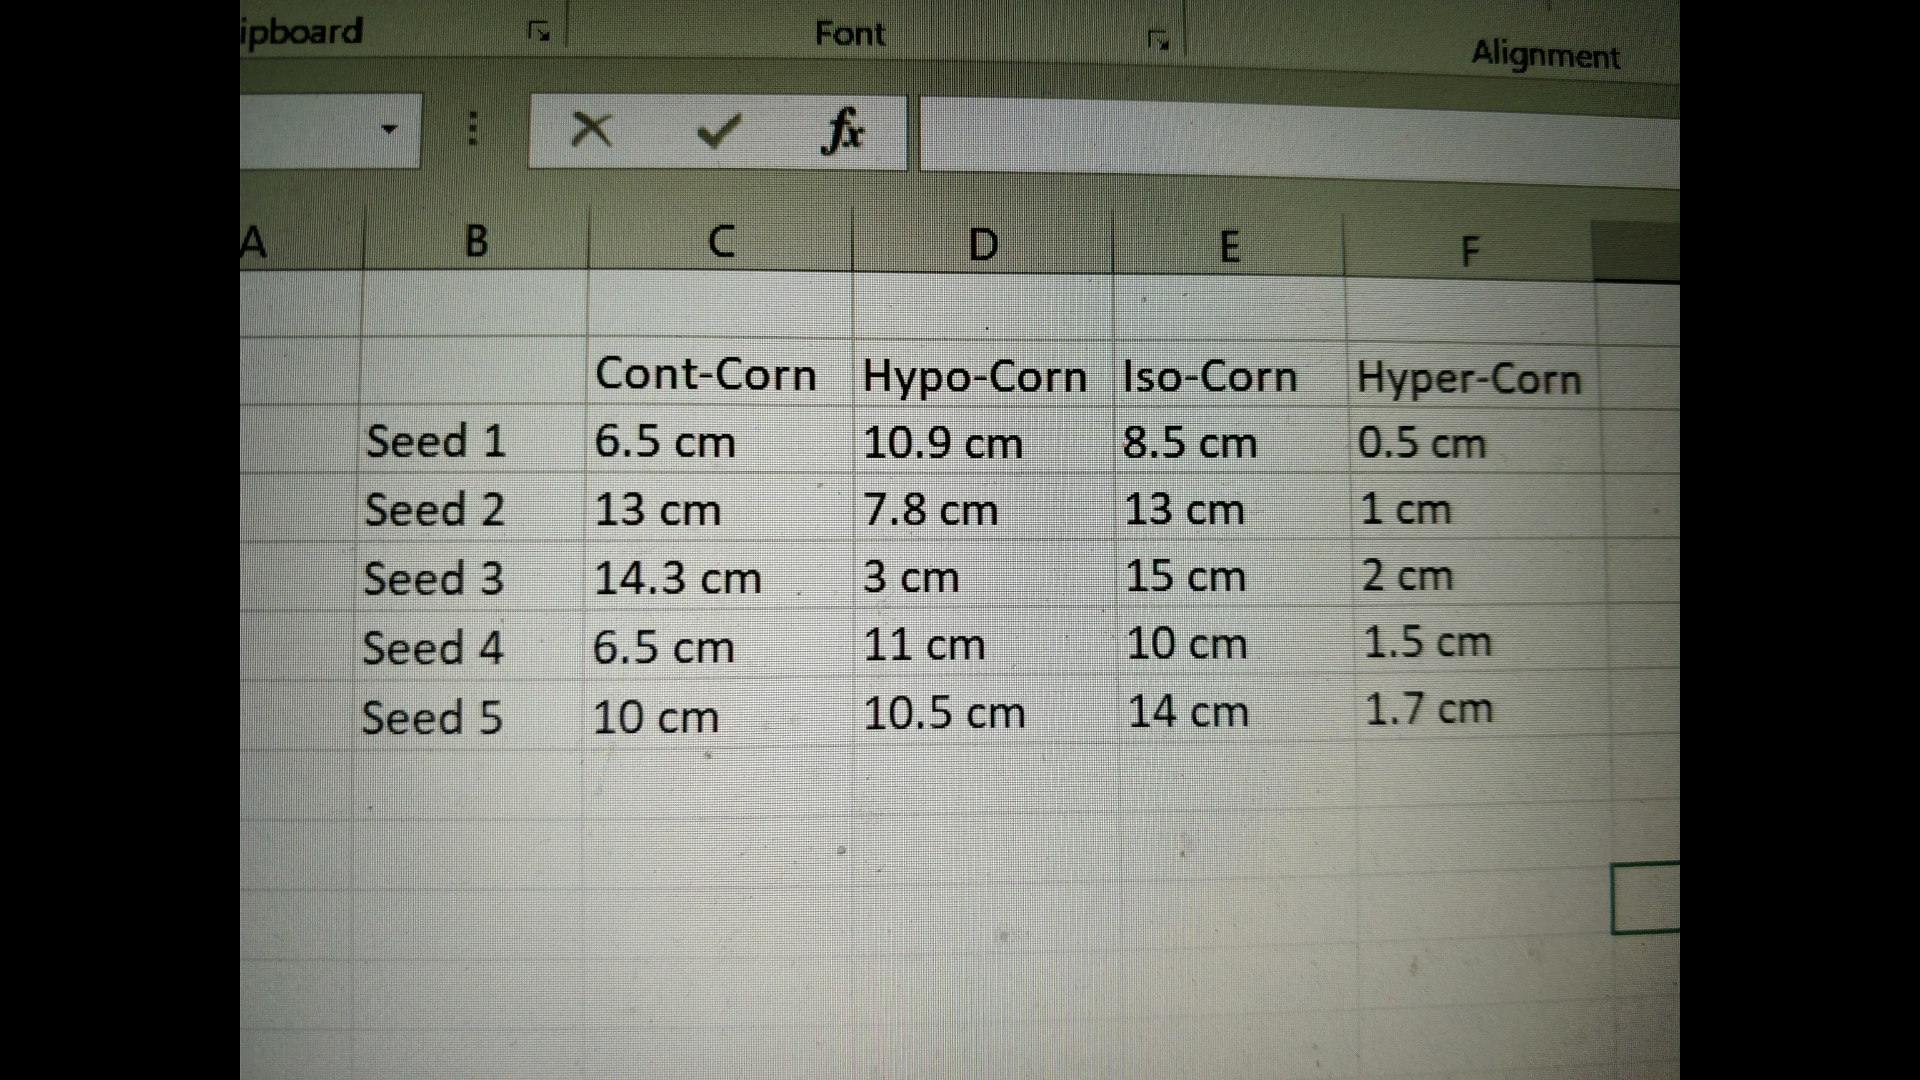
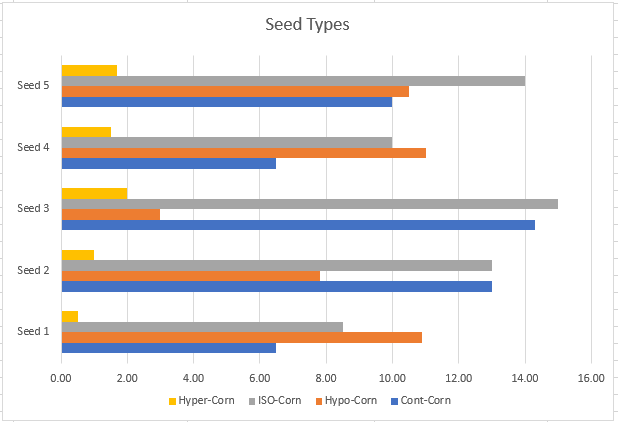
How do i graph this table as a clustered bar graph on excel? I can't get it work.

I have Excel 2016. I can never get anything to graph on excel unless i spend several hours trying.

I have Excel 2016. I can never get anything to graph on excel unless i spend several hours trying.
1 Answer
May 21, 2018
Please read the explanation.
Explanation:
Given Excel data set :

From the data set, Select the required region for graphing:


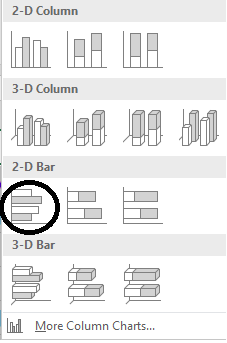
Select:
Insert
Select:


Choose an appropriate Chart Title.
Save you Excel work.
Hope this solution process meets your expectations.

