How do I visualize derivatives? I know how to derive functions, but for some reason I need a visual to fully understand the concept.
1 Answer

See answer below
Explanation:
Given: How do I visualize derivatives?
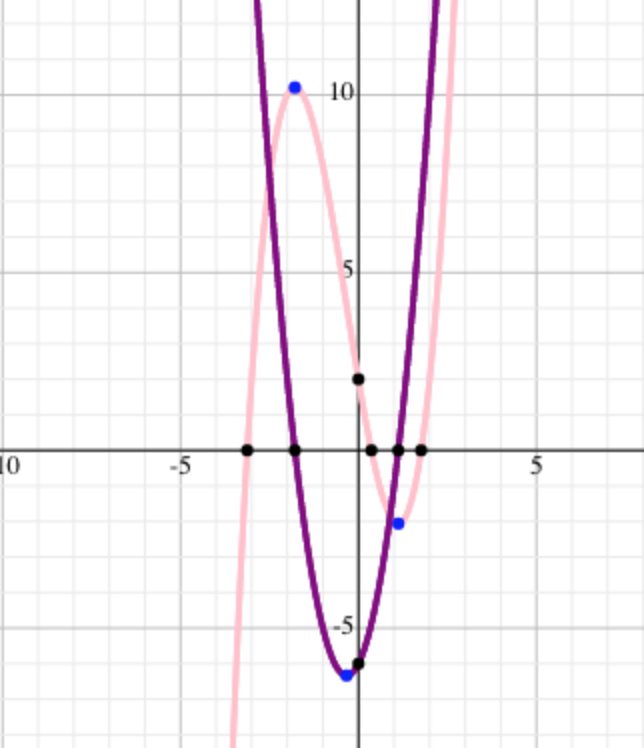
Derivatives are slope functions. When you evaluate a derivative at any location along the original function, you get the slope at that location.
If the original function is a cubic (degree = 3), then it's first derivative is a quadratic (degree = 2) function. Wherever there was a relative maximum or relative minimum in the original function, the slope will be zero which means the first derivative's
This would be the degree of the derivatives is you have a cubic function as the original function:
1st derivative: quadratic
2nd derivative: linear function
3rd derivative: horizontal line
4th derivative: y = 0
Here's an example: