You draw the graph of the line #y=3x+5# but make the line dotted.
Label the line #y>3x+5#
Note that if instead we hade #y>=3x+5# the line would be solid.
If you draw a line parallel to the y-axis through any x-value the value of y can be any on that vertical line that is above but not on the line #y=3x+5#. So you end up with a 'feasible' region of solutions for #y#
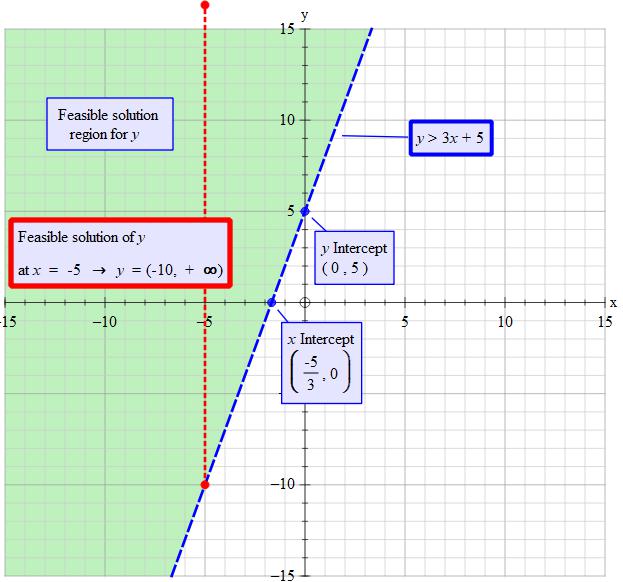
Note that #(-10,+oo)# is the range of values that #y# can be at #x=-5#. The curved bracket means 'excluding' . So #y# can not take on the values of -10 or #oo#. Infinity is infinity and you never get there so #y# can never get to infinity.
~~~~~~~~~~~~~~~~~~~~~~~~~~~~~~~~~~~~~~~~~~
y-intercept is at #x=0#
#y>3x+5 color(white)("ddd")->color(white)("ddd") y>3(0)+5#
#color(white)("dddddddddddd")->color(white)("ddd")y > 5#
y-intercept at #y=+5#
~~~~~~~~~~~~~~~~~~~~~~~~~~~~~~~~~~~~~~~
x-intercept is at #y=0#
#y>3x+5 color(white)("ddd")->color(white)("ddd") 0>3x+5#
Subtract 5 from both sides
#color(white)("dddddddddddd")->color(white)("ddd")-5 > 3x#
Divide both sides by 3
#color(white)("dddddddddddd")->color(white)("ddd") -5/3>x #
x-intercept at #x=-5/3#

