How do you estimate the area under the graph of #y=2x^3+4x# from 0 to 3 using 4 approximating rectangles of equal width and right endpoints?
1 Answer
Dividing the width
implies that each rectangle will have a width of
(This would have been so much easier with
The
Left Edge at
with corresponding
(plugging the x Left and Right Edge values into the given formula to obtain the y Left and Right values).
...and so on for the
(it's only the Right y values that of interest to us in this case).
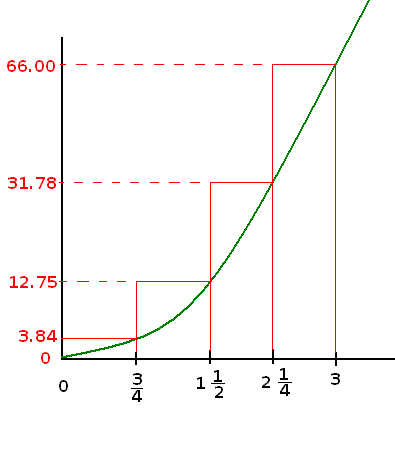
The areas of the 4 rectangles (using the Right endpoints) are
Giving at total area of
(Note that the graph is representational and not accurate, and that all calculations are only carried out to 2 significant places to the right of the decimal point).
