By the First Derivative Test , if some function #f# has a critical number at #c#, then:
- If #f'# changes from positive to negative at #x=c#, then #f# has a local maximum at #c#
- If #f'# changes from negative to positive at #x=c#, then #f# has a local minimum at #c#
To determine local extrema using the First Derivative Test, take the first derivative of the function and set it equal to #0#. Solving for all possible values of #x# which satisfy this will yield critical numbers. You can then test those critical numbers to determine if they represent a local maximum, minimum, or neither by checking the intervals of increase and decrease of the derivative relative to those points.
- If #f'(x)# is positive on interval #I#, then #f# is increasing on #I#
- If #f'(x)# is negative on interval #I#, then #f# is decreasing on #I#
The function we are given is #f(x)=2x^3-5x^2-4x+7#
Taking the first derivative,
#f'(x)=6x^2-10x-4#
#=>0=6x^2-10x-4#
We can factor:
#0=(3x+1)(2x-4)#
And solving for #x#,
#x=-1/3, x=2#
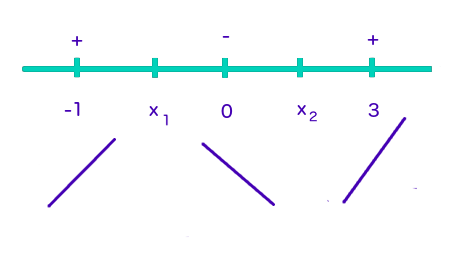
These are our critical numbers. We now pick test points near these values for #x# (I would recommend integers) and check to see if they yield a positive or negative first derivative. Note that we want test points which fall on either side of our critical numbers. I would use test points of #-1,0,3#. I good way to organize this is with a number line.

Where #x_1=-1/3# and #x_2=2#
We now check #f'(x)# at #x=-1,0,3#
#f'(-1)# yields a positive answer.
#f'(0)# yields a negative answer.
#f'(3)# yields a positive answer.
Thus, #f# is increasing at #x=3# and #x=-1#, but decreasing at #x=0#. We can draw lines with positive or negative slopes respective to the signs of the derivatives to help us visualize where we might have a maximum or minimum (this is not necessary by any means, but can be a useful strategy until you are comfortable finding extrema).

We can see #x_1# appears to be at the top of peak of the lines on either side. We know that #x=-1/3# is a local maximum. Similarly, we can see that at #x_2# appears to be at the bottom of a peak of the lines on either side. We know that #x=2# is a local minimum.
We can then put those values of #x# back into the original function to determine the corresponding #y# values and get coordinates.
#f(-1/3)=208/27#
#f(2)=-5#
Thus, we have a local maximum at #(-1/3,208/27)# and a local minimum at #(2,-5)#.
We can see this is correct if we look at the graph of #f(x)#:
graph{2x^3-5x^2-4x+7 [-10, 10, -5, 5]}


