To graph this reasonably precisely you need to calculate a whole series of value as Brian did.
To 'sketch' the graph you calculate the critical points and end behaviour then draw you best estimate through those points knowing what the general shape is.
Lets consider critical points and end behaviour.
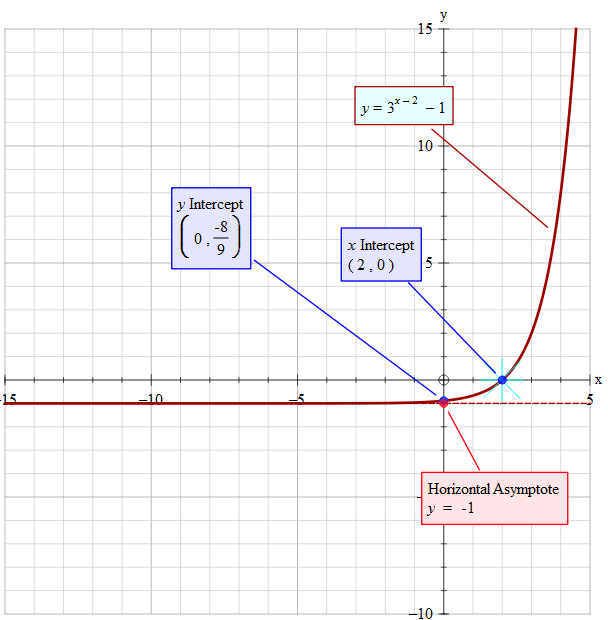
Set #" "y=3^(x-2) -1#
#color(blue)("Consider the case "x=0 ->" y-axis intercept")#
This gives: #y=3^(-2)-1" "->" "y=1/3^2-1 " "=" "-8/9#
#color(green)(y_("intercept")->(x,y)=(0,-8/9))#
~~~~~~~~~~~~~~~~~~~~~~~~~~~~~~~~~~~~~~~~~~~~~~~
#color(blue)("Consider the case "y=0 ->" x-axis intercept")#
#0=3^(x-2) -1#
#3^(x-2)=+1#
Take logs of both sides: I choose natural logs (ln)
#(x-2)ln(3)=ln(1)#
#x=ln(1)/ln(3)+2" " =" "0/ln(3)+2" "=" "2#
#color(green)(x_("intercept")->(x,y)=(2,0)#
~~~~~~~~~~~~~~~~~~~~~~~~~~~~~~~~~~~~~~~~~~~~~
#color(blue)("Consider the case "x=+2 )#
#y=3^(2-2)-1" "->" "y=1-1=0#
#color(green)("point "P_(x" ="2)->(x,y)=(2,0) =x_("intercept"))#
~~~~~~~~~~~~~~~~~~~~~~~~~~~~~~~~~~~~~~~~~~
#color(blue)("Consider the case "x -> +oo )#
As #x# becomes greater and greater the influence by subtracting 2 from it reduces. So #lim_(x->+oo) 3^(x-2) ->3^oo->+oo #
The subtraction of 1 from #oo# is of no consequence
So we have:
#color(green)(lim_(x->oo) 3^(x-2)-1 ->oo)#
~~~~~~~~~~~~~~~~~~~~~~~~~~~~~~~~~~~~~~~~~~~
#color(blue)("Consider the case "x -> -oo )#
For #x<2# we have
#lim_(x->-oo)1/3^(x-2)-1 " "->" "1/oo-1" "=" "0-1" "=-1#
#color(green)("So we have a horizontal asymptote at y=-1"#
~~~~~~~~~~~~~~~~~~~~~~~~~~~~~~~~~~~~~~~~~~~~~~~~~~