y axis intercept occurs when #x=0#
#y=(1/4)^(0+4)-3=1/256-3=color(blue)(-767/256)#
x axis intercept occurs when #y=0#
#(1/4)^(x+4)-3=0#
#(1/4)^(x+4)=3#
#(x+4)ln(1/4)=ln3=>x=(ln3)/(ln(1/4))-4~~color(blue)(-4.792)#
There are no constraints on #x# so domain is:
#color(blue)({x in RR})#
as #x->oo# , #color(white)(888)(1/4)^(x+4)->0#
So:
as #x->oo# , #color(white)(888)(1/4)^(x+4)-3->-3#
The line #color(blue)(y=-3) color(white)(88)# is a horizontal asymptote.
For #x<-4#
#(1/4)^(x+4)# becomes #color(white)(888)1/((1/4)^(x+4))#
So:
as #x->-oo# , #color(white)(888)1/((1/4)^(x+4))->oo#
and:
#x->-oo# , #color(white)(888)1/((1/4)^(x+4))-3->oo#
Range:
#color(blue)({y in RR : -3 < y < oo })#
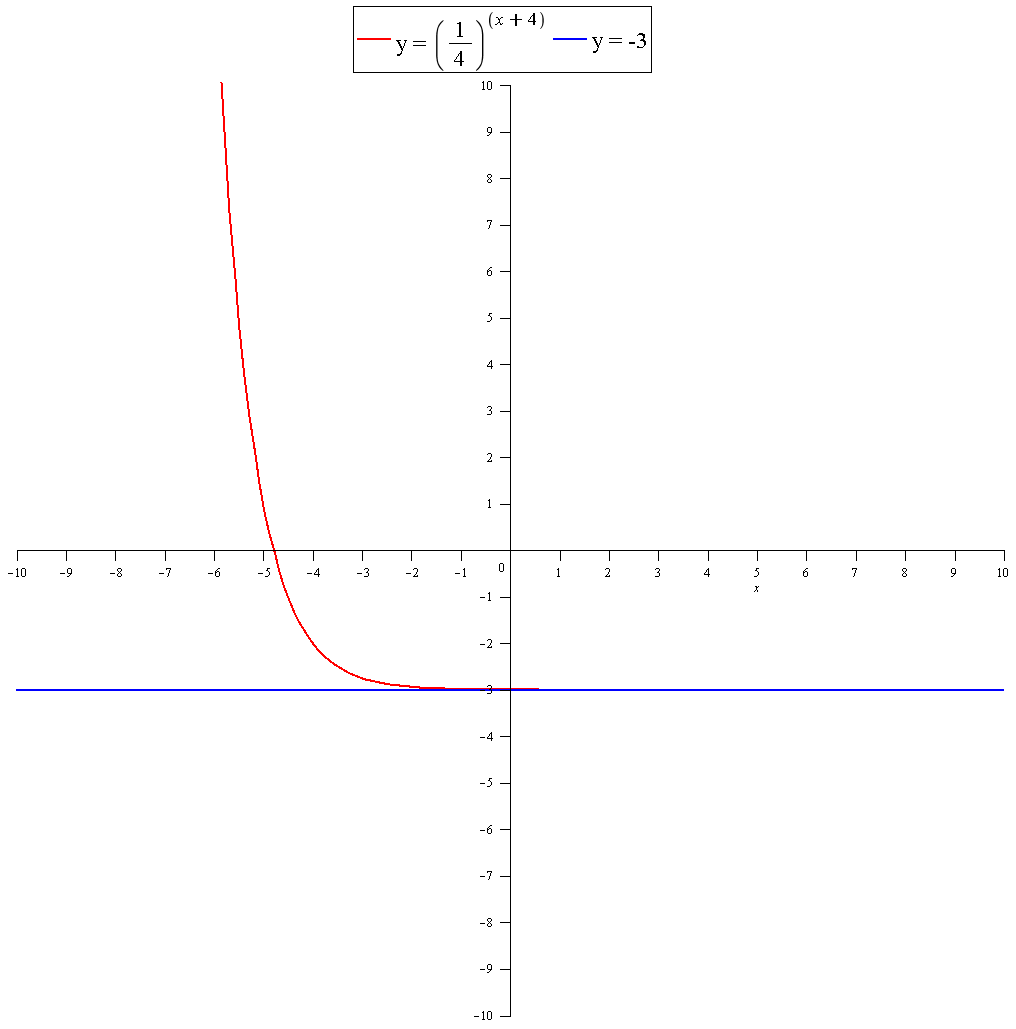
Graph: