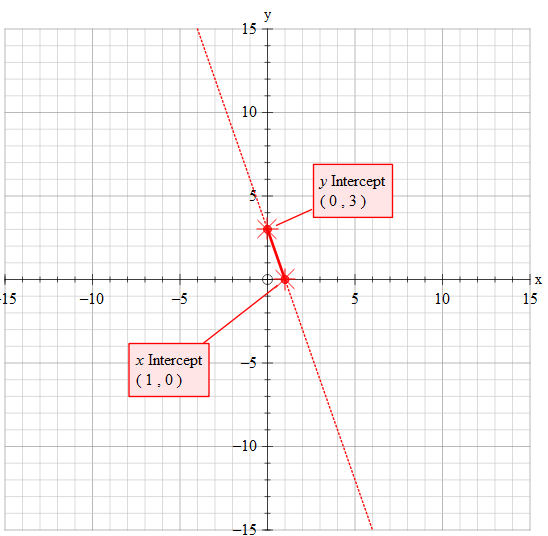
How do you graph the line # y=-3x+3#?

1 Answer
Dec 18, 2016

Wee explanation

Explanation:

#color(blue)("Main Method :")#

Determine 2 separate points which are marked on the graph paper then draw a line through them.
~~~~~~~~~~~~~~~~~~~~~~~~~~~~~~~~~~~~~~~~~~~~~~~~~~~~

#color(purple)("Method 1") #

Substitute any sensible values into #x# and se what value of #y# you get. Then plot the points with a line going through them.

~~~~~~~~~~~~~~~~~~~~~~~~~~~~~~~~~~~~~~~~~~~~~~~~~~~~~
#color(purple)("Method 2 - more about teaching algebra")#

#color(blue)("Determine the point where "x=0)#

Substitute 0 wherever #x# is

#y=-3x+3" "->" "y=-3(0)+3#

but #0xx(-3)=0# giving:

#y=0+3#

So at #x=0" "y# takes on the value of 3

So point 1 #->P_1->(x,y)=(0,3)#
.......................................................................................
#color(blue)("Determine the point where "y=0)#

Substitute 0 wherever #y# is:

#y=-3x+3" "->" "0=-3x+3#

Add #3x# to both sides

#0+3x=-3x+3x+3#

but #-3x+3x=0#

#3x=0+3#

Divide both sides by 3

#3/3x=3/3#

But #3/3=1#

#x=1#

So point 2 #->P_2->(x,y)=(1,0)#
~~~~~~~~~~~~~~~~~~~~~~~~~~~~~~~~~~~~~~~
Tony B