How do you graph the line #y=-x+2#?
1 Answer

I decided that the best way to do this is by using pictures with a bit of explanation
Explanation:
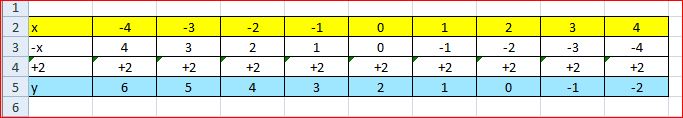
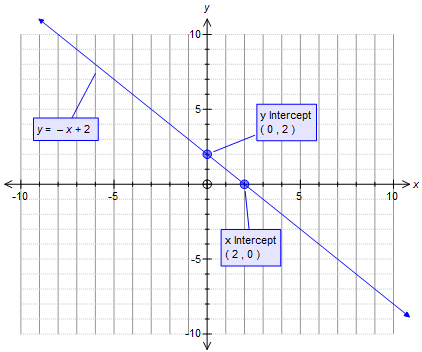
The equation
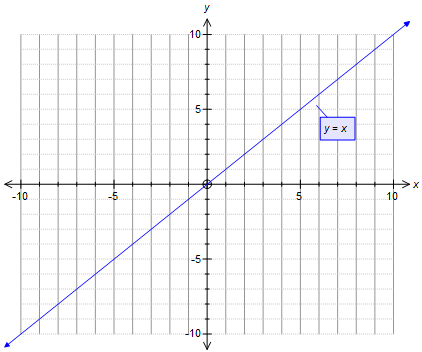
Notice that the graph goes upwards as you move from left to right
This is called a positive slope (gradient)
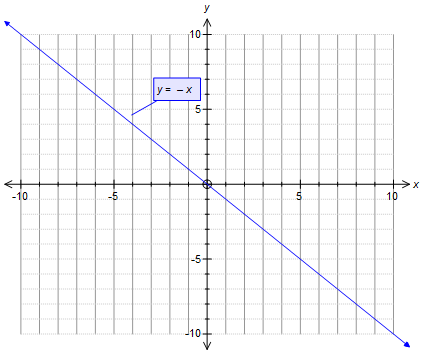
If it had been
'~~~~~~~~~~~~~~~~~~~~~~~~~~~~~~~~~~~~~~~~~~~
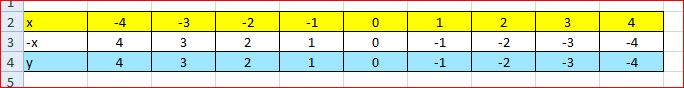
This is what happens when the
Negative values of
Positive values of
'~~~~~~~~~~~~~~~~~~~~~~~~~~~~~~~~~~~~~~~~~~~~~~~~~~~
The equation