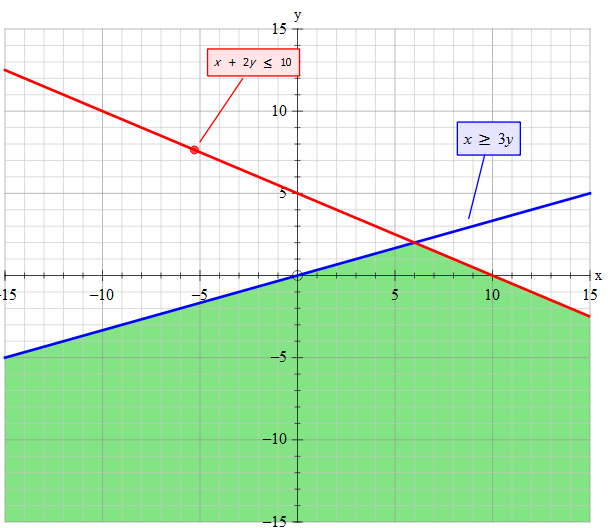
How do you graph the solution of the system of linear inequalities #x>=3y# and #x+2y<=10#?
1 Answer

May 29, 2017
See the explanation
Explanation:
To plot the boundaries we need derive the following equations:
Consider the case
Consider the case
Feasible solutions are all the points in the shaded area extrapolated to