How do you graph #y=2 cos(-x)+3#?
1 Answer
Oct 25, 2014
Cosine is an even function so the
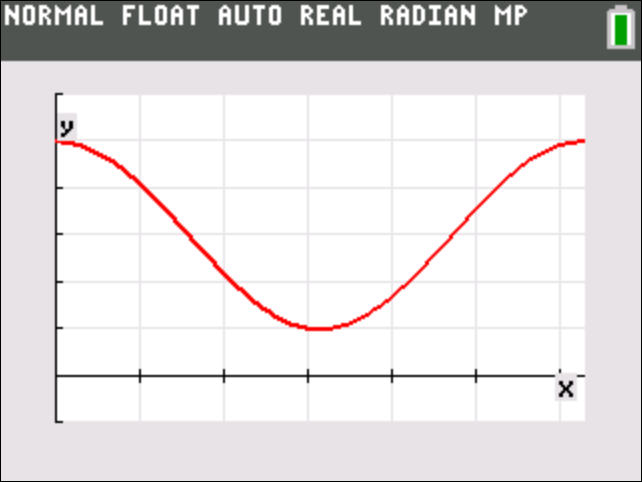
The amplitude of this function is 2.
This is a graph of the cos(x) shifted 3 units vertically.
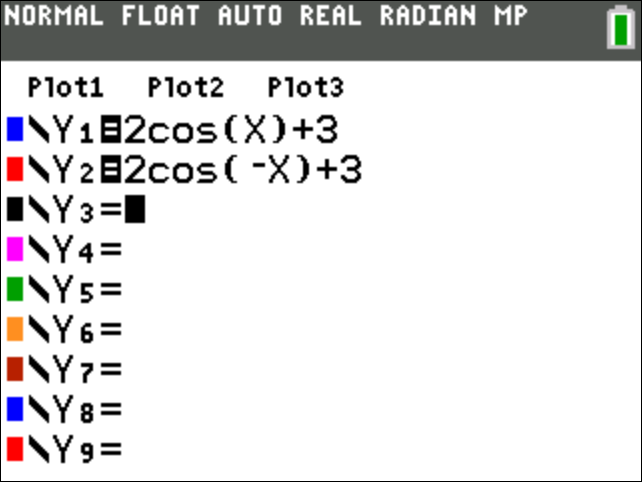
The red curve is the original equation.
The blue curve is the new equation showing that cosine is an even function .

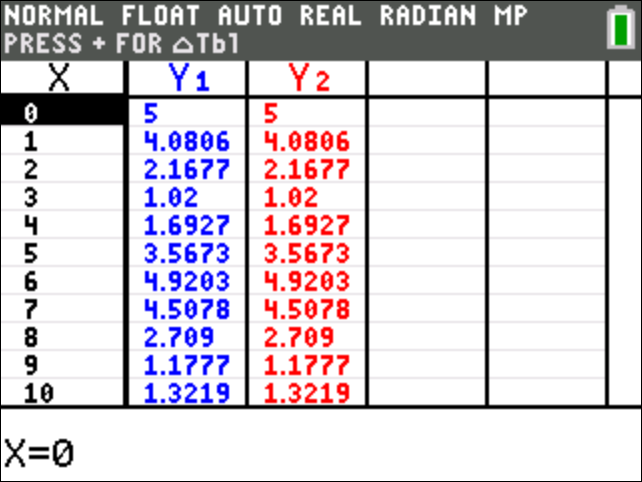
The red and blue color signify the same functions as above.
The point of this image is to show that both functions result in the same curve.

Graph of the original equation


