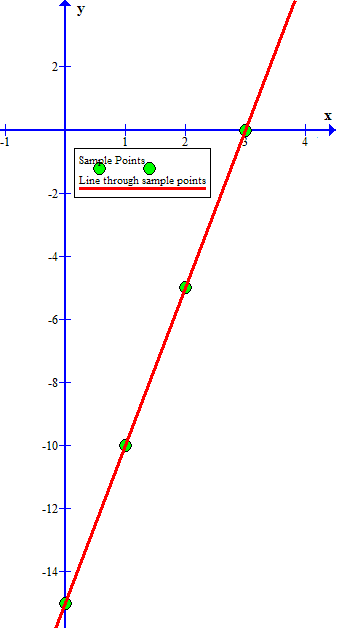
How do you graph #y = 5x - 15# by plotting points? Algebra Graphs of Linear Equations and Functions Graphs of Linear Equations 1 Answer Alan P. May 4, 2017 Pick a few sample values for #x# and generate corresponding values for #y#; plot the coordinates generated in this manner; draw a line through those coordinate points. Explanation: Example: #color(white)("XXX"){: (ul(x),color(white)("XX"),ul(y=5x-15)), (0,,-15), (1,,-10), (2,,-5), (3,,0) :}# Answer link Related questions How do you graph # y=4x+7#? How do you graph #p=2(h)#? How many points do you need to plot? How do you know which variable is the "x" and the "y"? How do you make a table? What does a graph of linear equations in two variables look like? How do you graph linear equations? How do you graph #y=6-1.25x#? How do you check your solutions? How do you graph #3x-2y=6# by the find the x and y intercepts? See all questions in Graphs of Linear Equations Impact of this question 2467 views around the world You can reuse this answer Creative Commons License