How do you graph #y= \log _ { 2} x + 2#?
1 Answer

Mar 29, 2018
Please read the explanation.
Explanation:
We are given
To draw the graph of this logarithmic function, we can create a table of values and plot the points.
The table below contains values of:
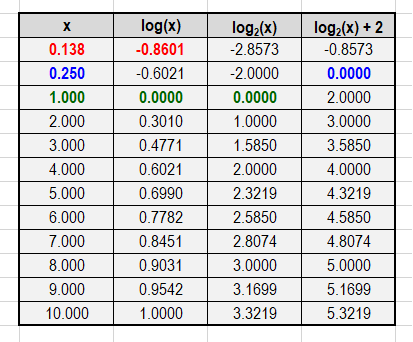
Note that values of
Compare the base function of
The idea was to compare these values with the graph generated and to verify the accuracy of the graph.
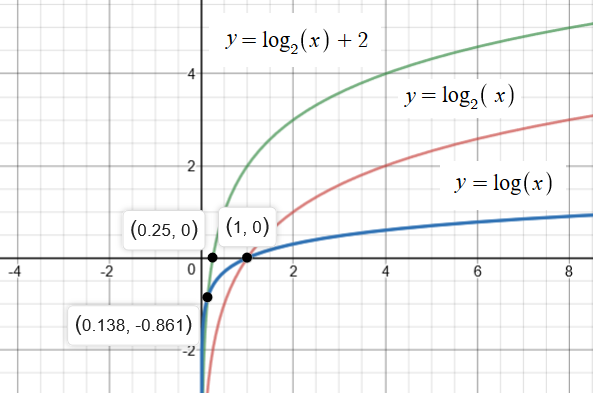
An image of the graph containing all the three functions: