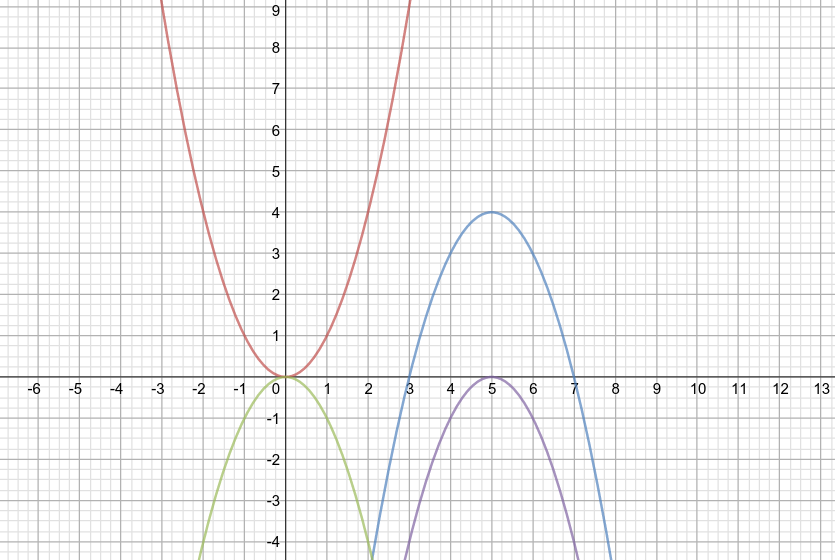
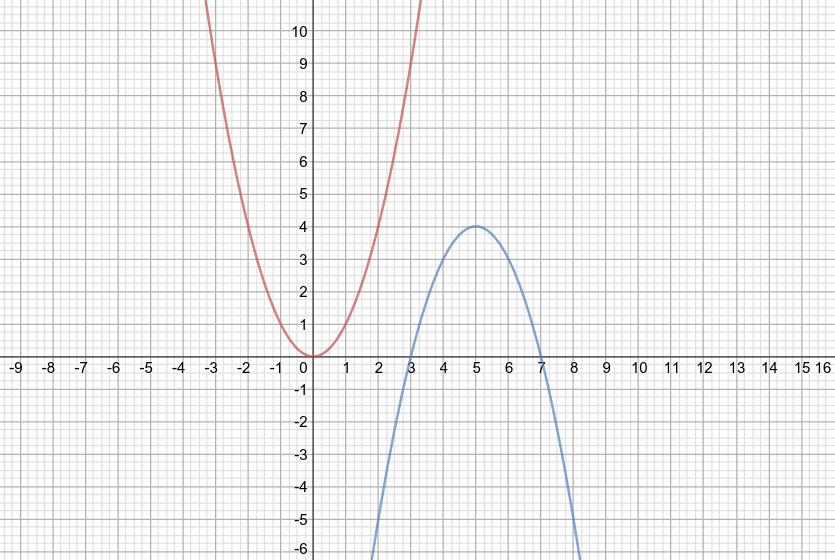
Let's consider a simple example: #color(red)(f(x) = x^2)# is the parent function, represented by the red curve.
The graph of the transformed function #color(blue)(g(x))# is colored in blue. Our goal is to find out the equation of the function #color(blue)(g)#
We notice that the transformed function #color(blue)(g)# is the outcome of several successive transformations applied to the parent function #color(red)(f)#:
1. Reflection of #f# across the #Ox# axis : this gives us the first transformed function #color(green)(f_1(x)=-x^2)#
2. Translation of #f_1# by 5 units to the right across the #Ox# axis: this gives us the second transformed function #color(indigo)(f_2(x) = -(x-5)^2)#
3. Translation of #f_2# by 4 units up across the #Oy# axis : this gives us the transformed function #g(x) = -(x-5)^2 + 4=x^2+10x-25 + 4# #-># #color(blue)(g(x)=-x^2+10x-21)#, that is the formula we were looking for.
Please find below the graphs of the successive transformations, represented in the corresponding colors (red, green, indigo, blue):