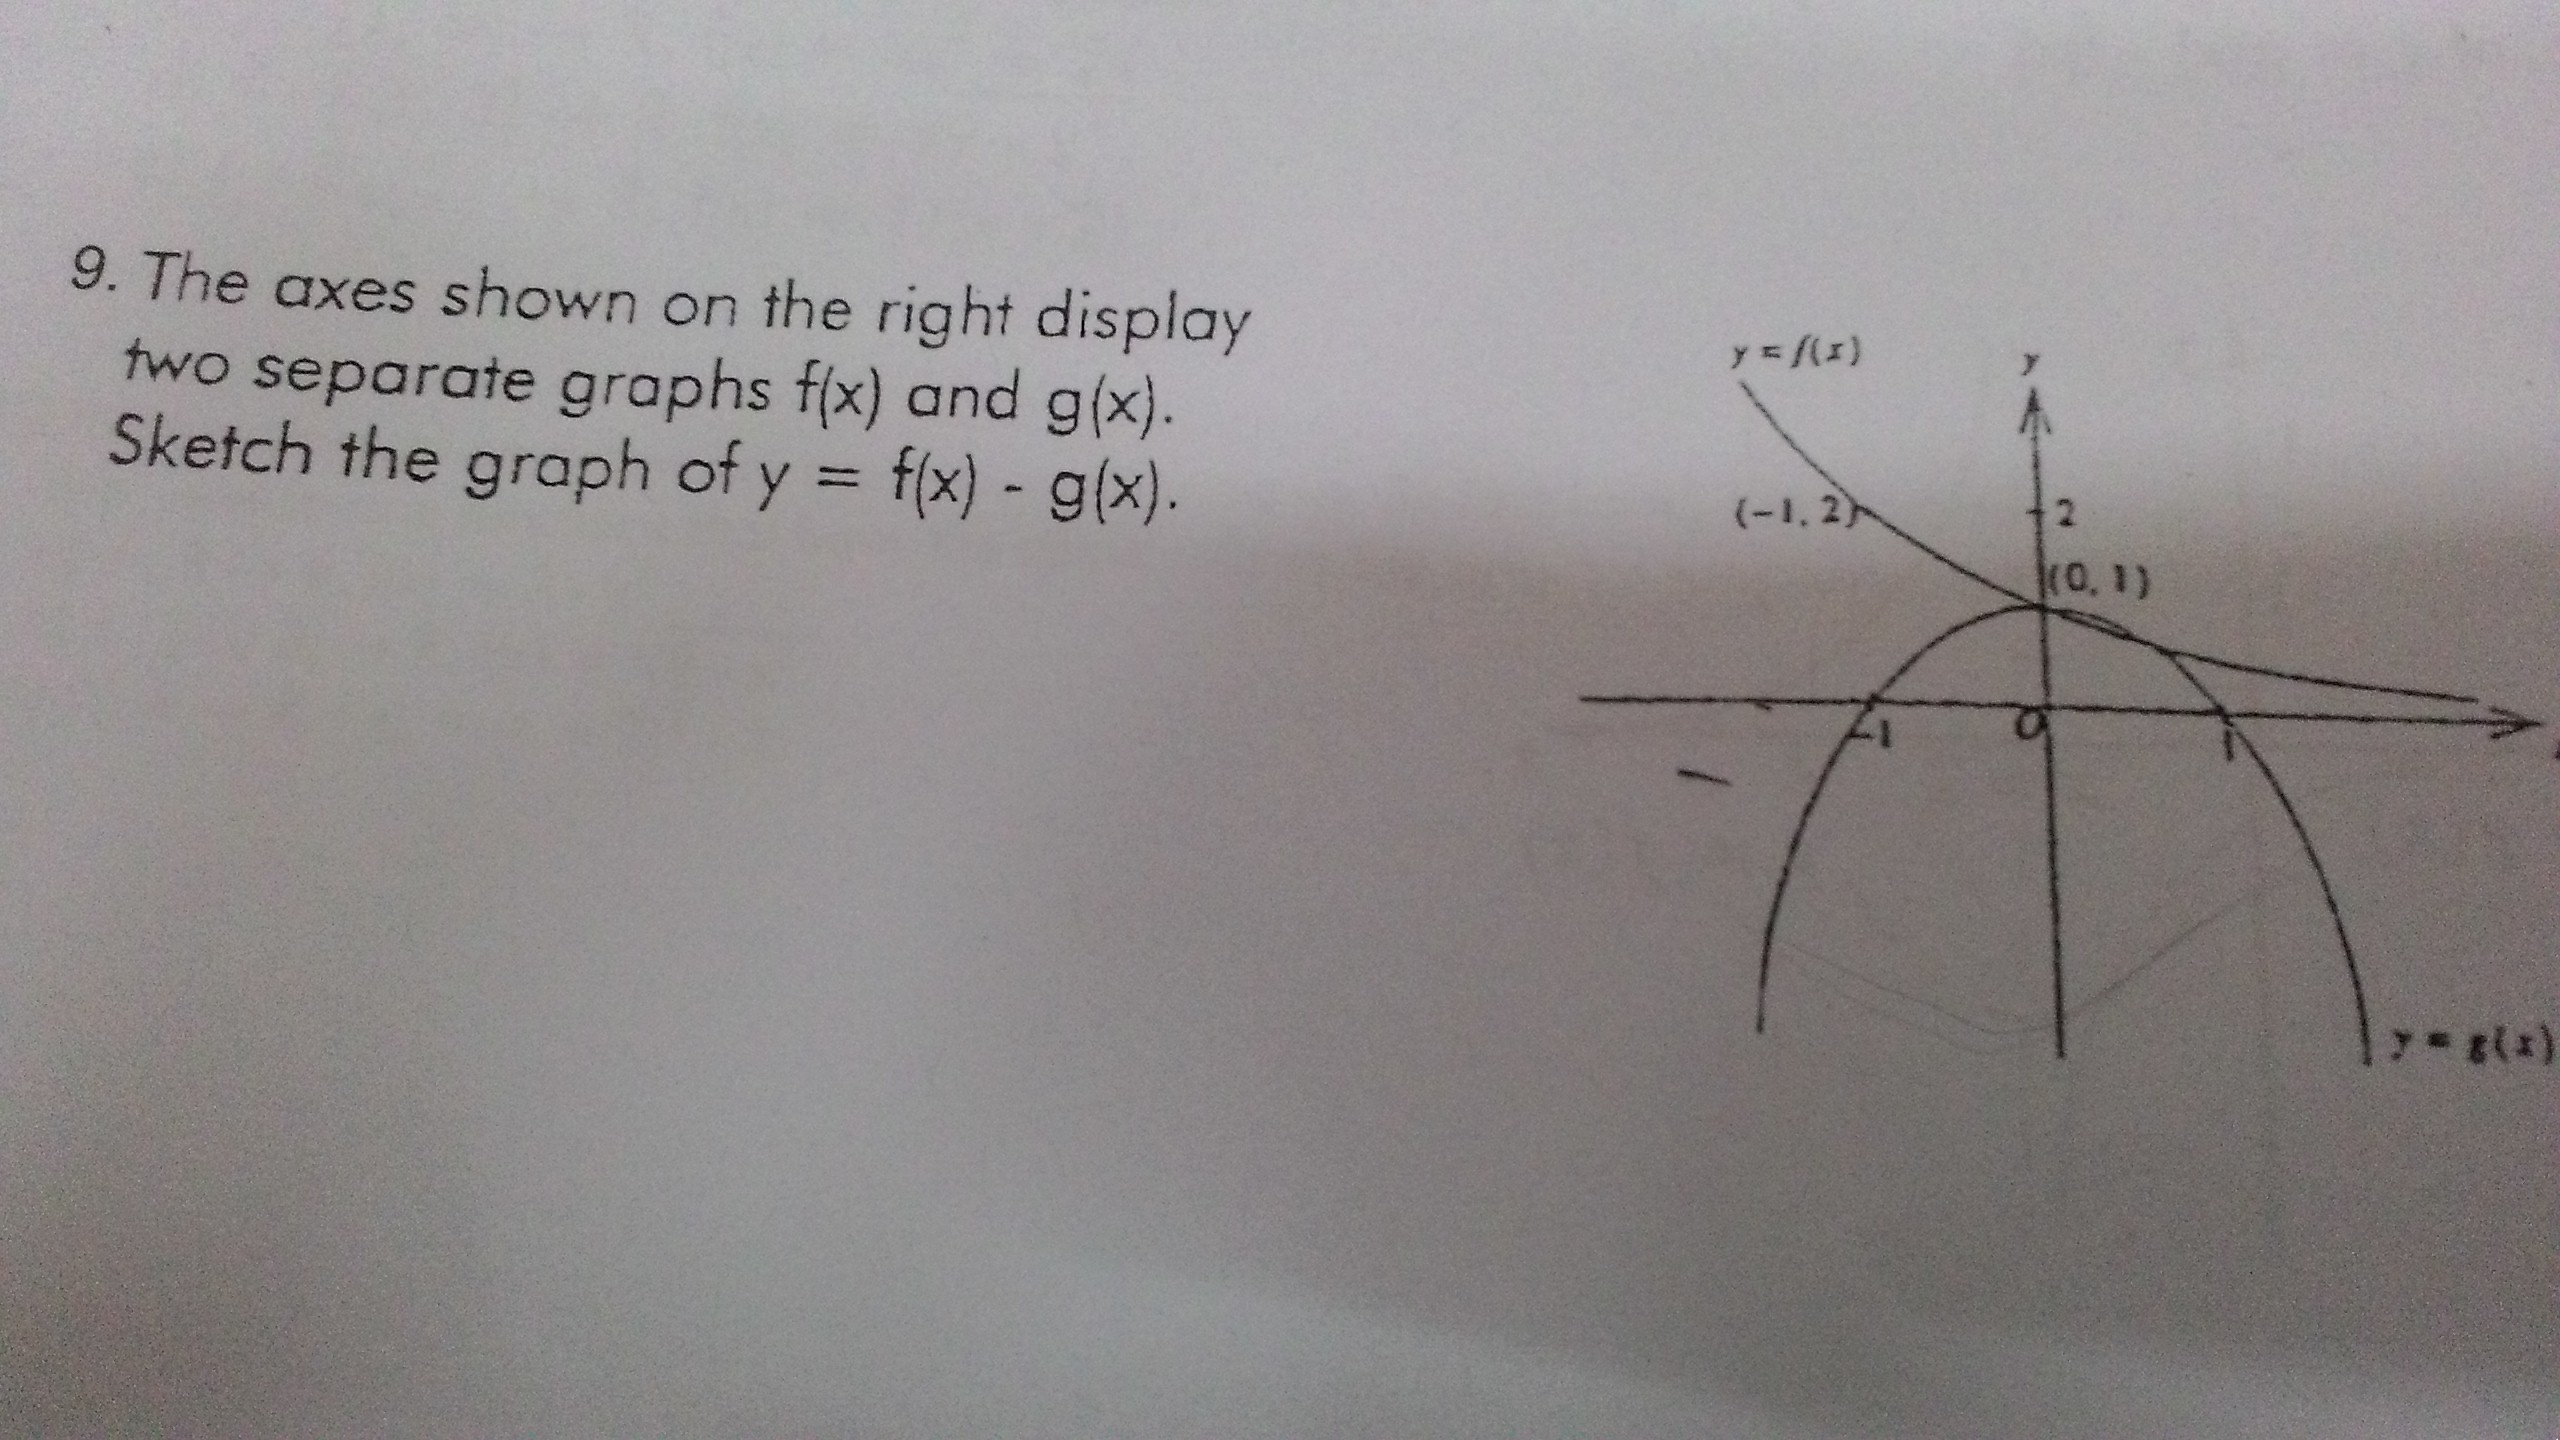
How does the graph f(x) - g(x) look like? Full question in the description box below.
1 Answer

See the explanation
Explanation:
Firstly the question uses the word 'sketch'. So what you draw does not have to be precise.
Let a sketched point be
Suppose we have:
So
Draw (lightly) a series of lines parallel to the y-axis. Where each line crosses the plots project a line parallel to the x-axis such that it meets the y-axis and approximate the value of the relevant
Then we have
Looking at your diagram I notice that we have two labelled points that have the same x-value.
So for this vertical line we have
I also notice that both plots have a shared point (both pass through it) at
