How to do this regression question?
Critics of television often refer to the detrimental effects that all the violence shown on television has on children. However, there may be another problem. It may be that watching television also reduces the amount of physical exercise, causing weight gains. A sample of #15# 10-year-old children was taken. The number of pounds each child was overweight was recorded (a negative number indicates the child is underweight). In addition, the number of hours of television viewing per week was also recorded. These data are listed here.
Television #42, 34, 25, 35, 37, 38, 31, 33, 19, 29, 38, 28, 29, 36, 18#
Overweight #18 ,6 ,0 ,-1 ,13 ,14 ,7 ,7 ,-9, 8, 8, 5, 3, 14, -7#
a. Draw the scatter diagram.
b. (i) Calculate the sample regression line, and
(ii) describe what the coefficients tell you about the relationship between the two variables.
Critics of television often refer to the detrimental effects that all the violence shown on television has on children. However, there may be another problem. It may be that watching television also reduces the amount of physical exercise, causing weight gains. A sample of
Television
Overweight
a. Draw the scatter diagram.
b. (i) Calculate the sample regression line, and
(ii) describe what the coefficients tell you about the relationship between the two variables.
1 Answer

The regression line is
Explanation:
Let
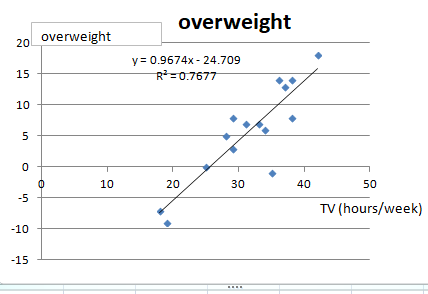
a. I put these data into Microsoft Excel and got the result.
b. (i) To find the sample regression line, you need the formula
(See also my previous post: https://socratic.org/questions/what-is-the-line-of-best-fit-data-down-below)
The results obtained by using Excel are:
Use AVERAGE, VARP and COVAR function to calculate average, variance and covariance, respectively.
The regression line is:
(ii) The correlation coefficient is
This implies those two variables have strong positive relationship. That is, the longer a child watches TV, the more he or she tends to be overweight.
I found a great explanation about linear regression using Microsoft Excel.
https://socratic.org/questions/how-can-you-explain-linear-regression-analysis-using-excel?source=search
[Note]
Since the given data is sample, I should have used VAR.S and COVARIANCE.S functions instead of VAR.P and COVAR.
However, the slope of the regression line is the same whichever functions we choose. So I used the simpler function.
(Thank you @Yiu A. and @Varun .) See also
https://socratic.org/questions/what-is-the-difference-between-var-s-function-and-var-p-function-on-microsoft-ex
